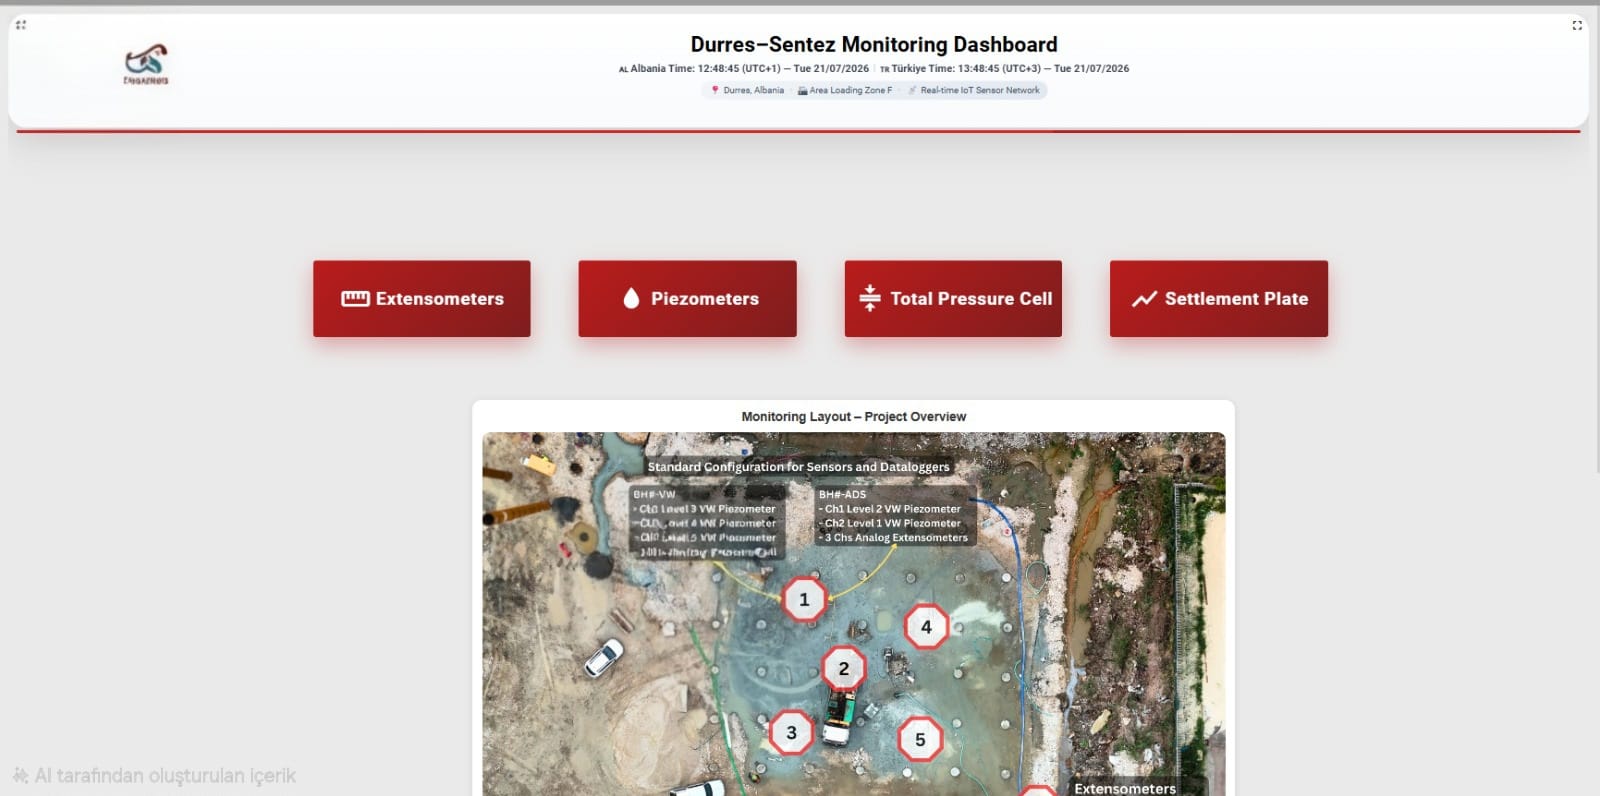
Monitoring Assets, Ensuring Safety

Turning Field Data into Real-Time Insights

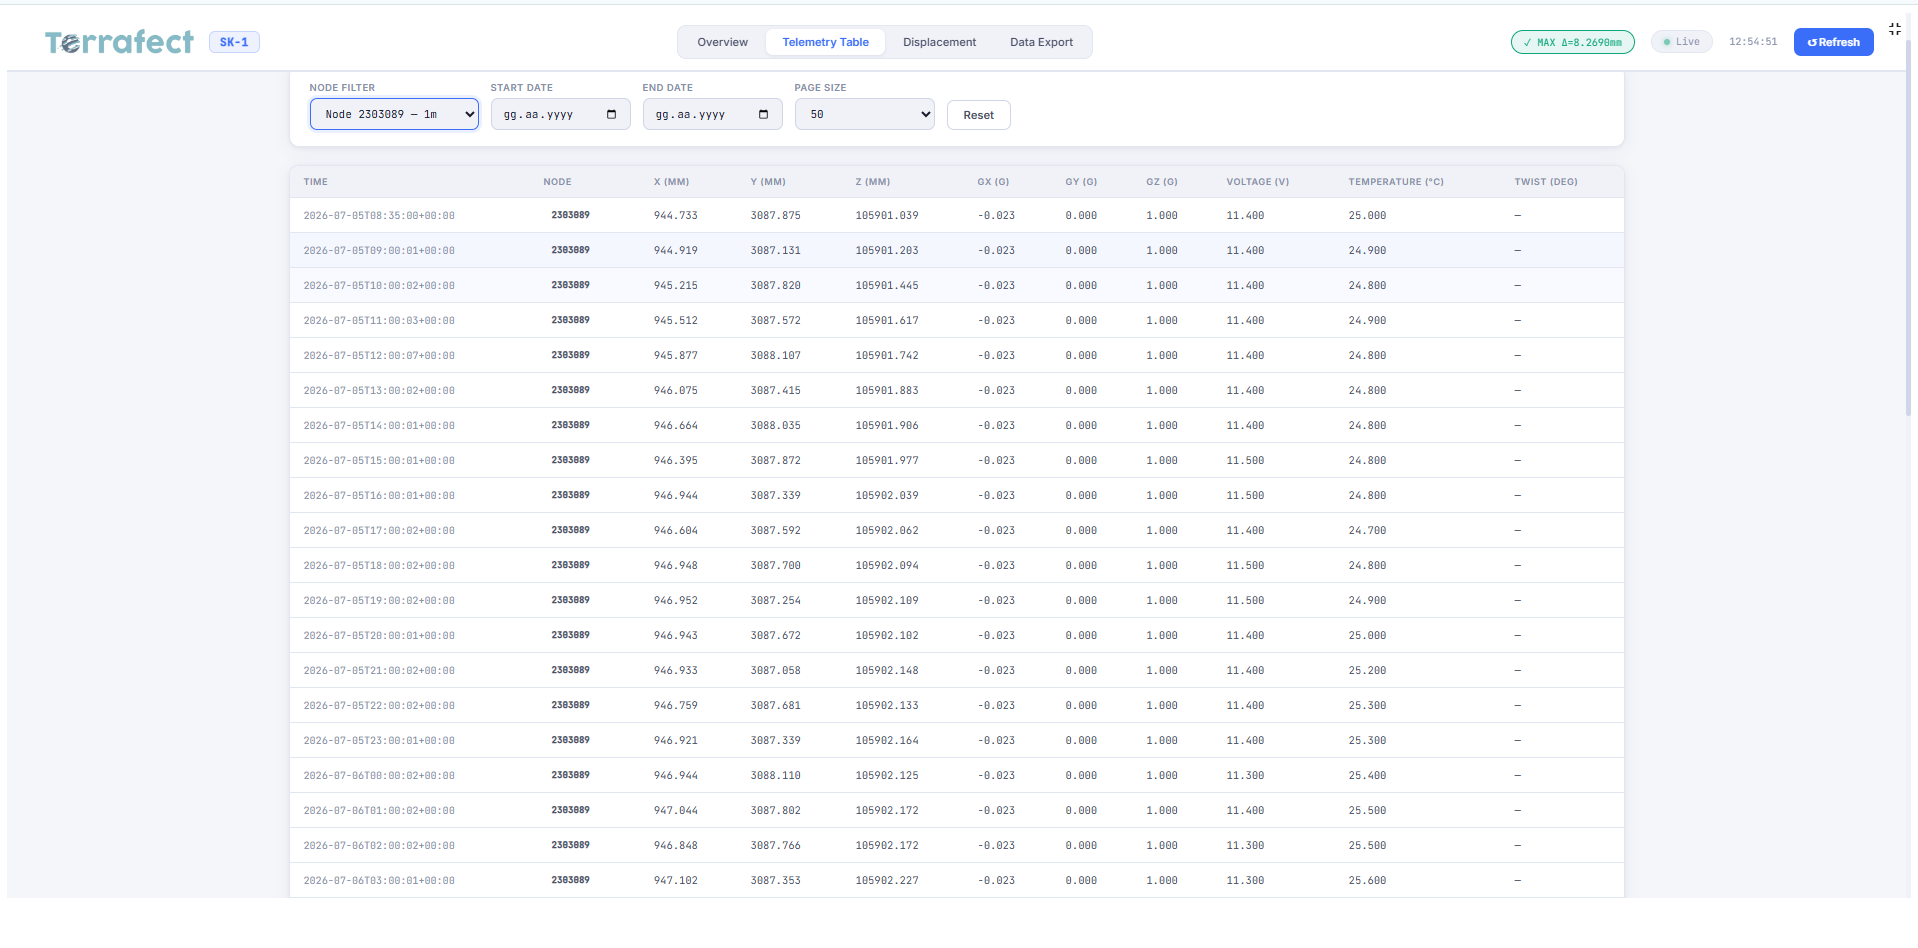
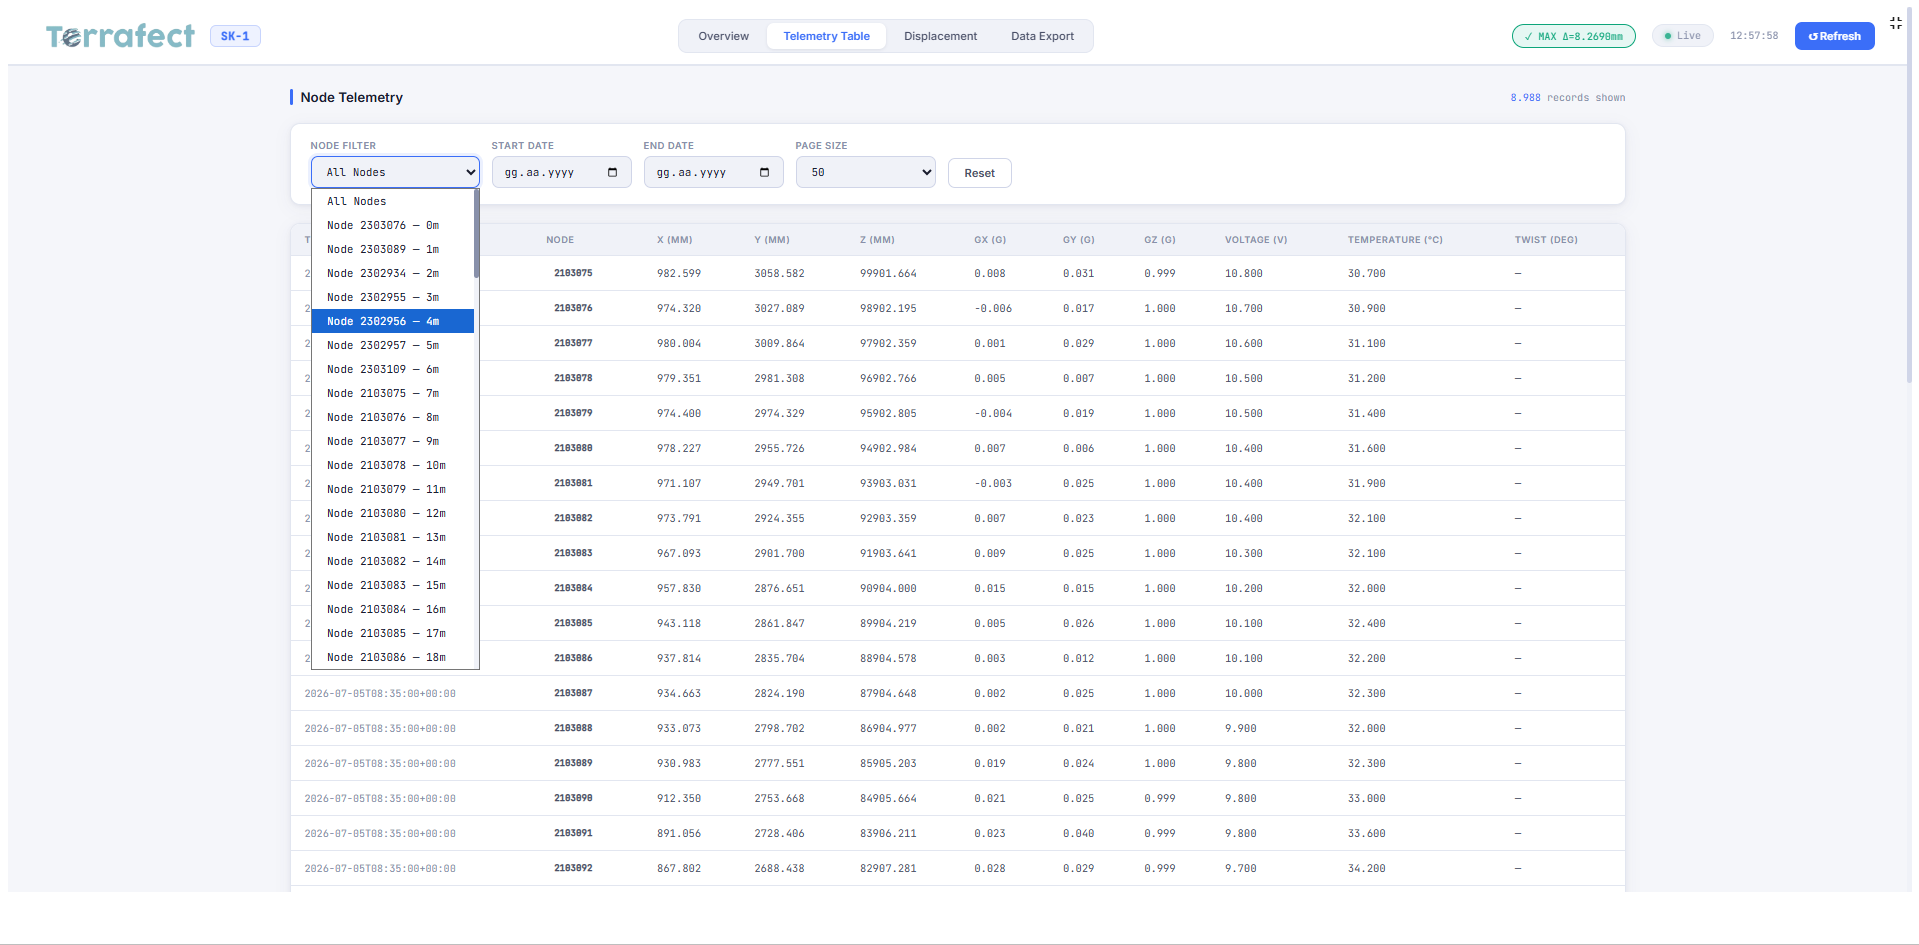
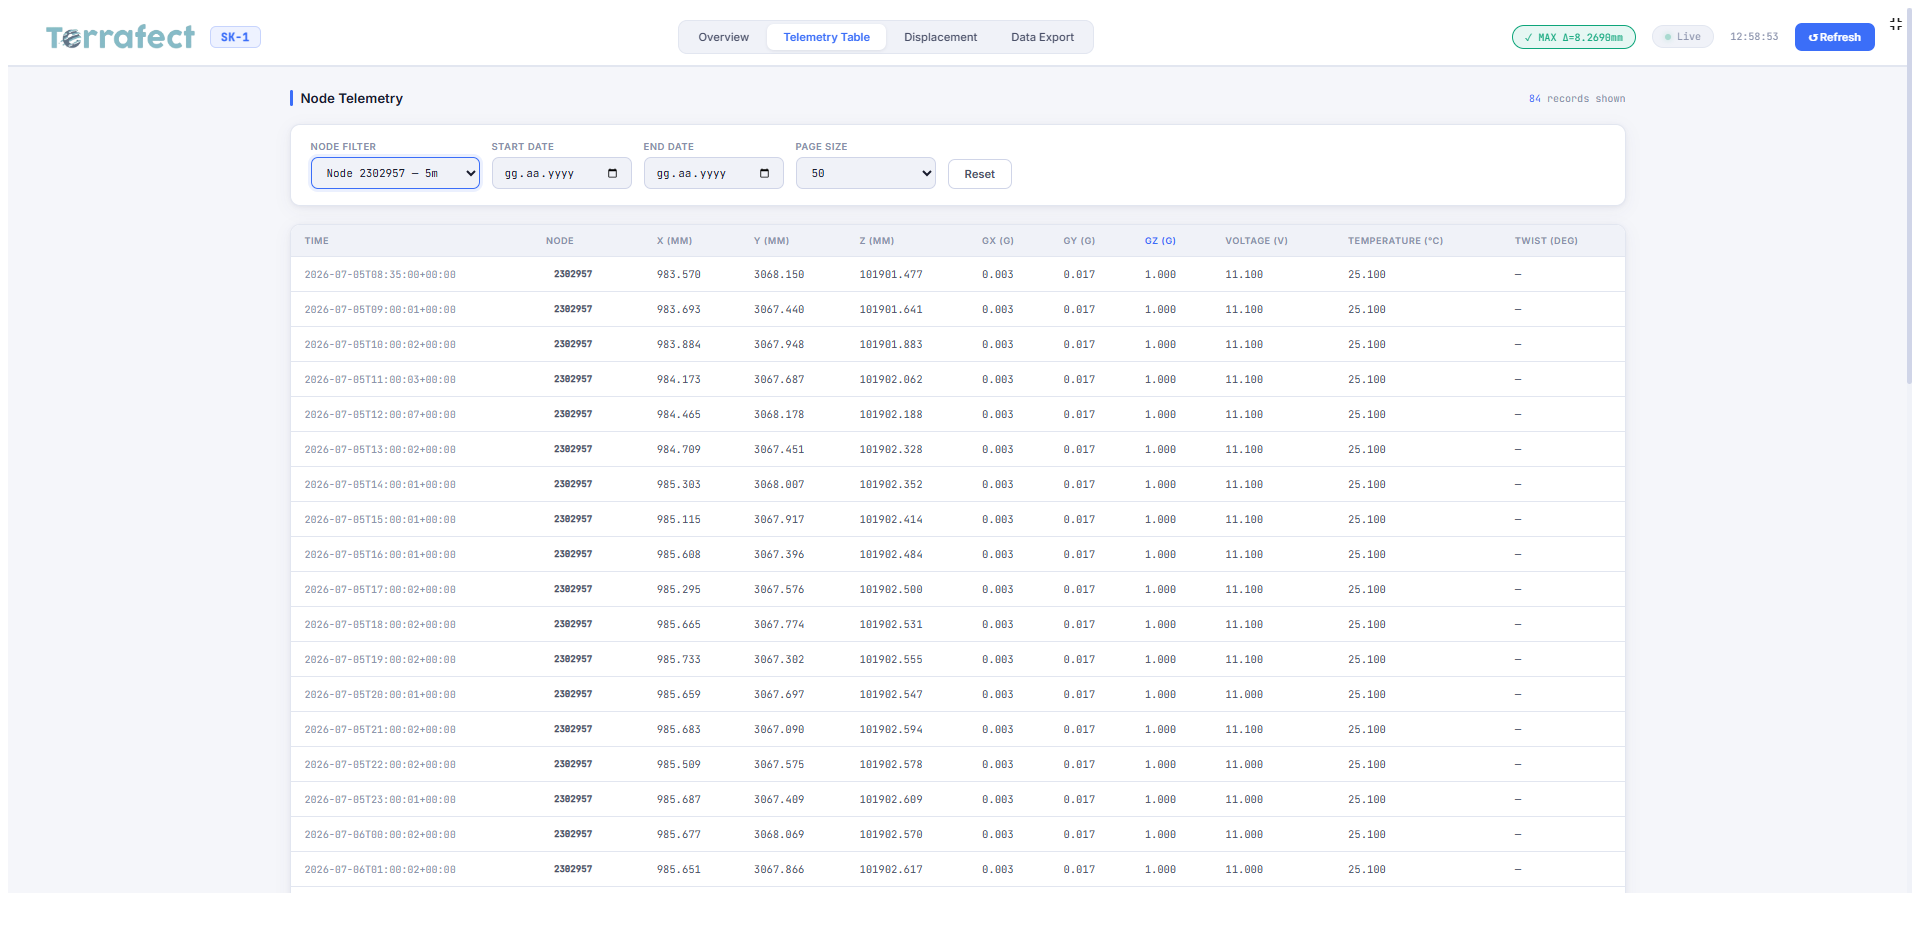
Brings clarity to complex sensor data, enabling informed decisions through actionable dashboards.

ENGINEERING DATA. EMPOWERING DECISIONS.
Dashboard background view
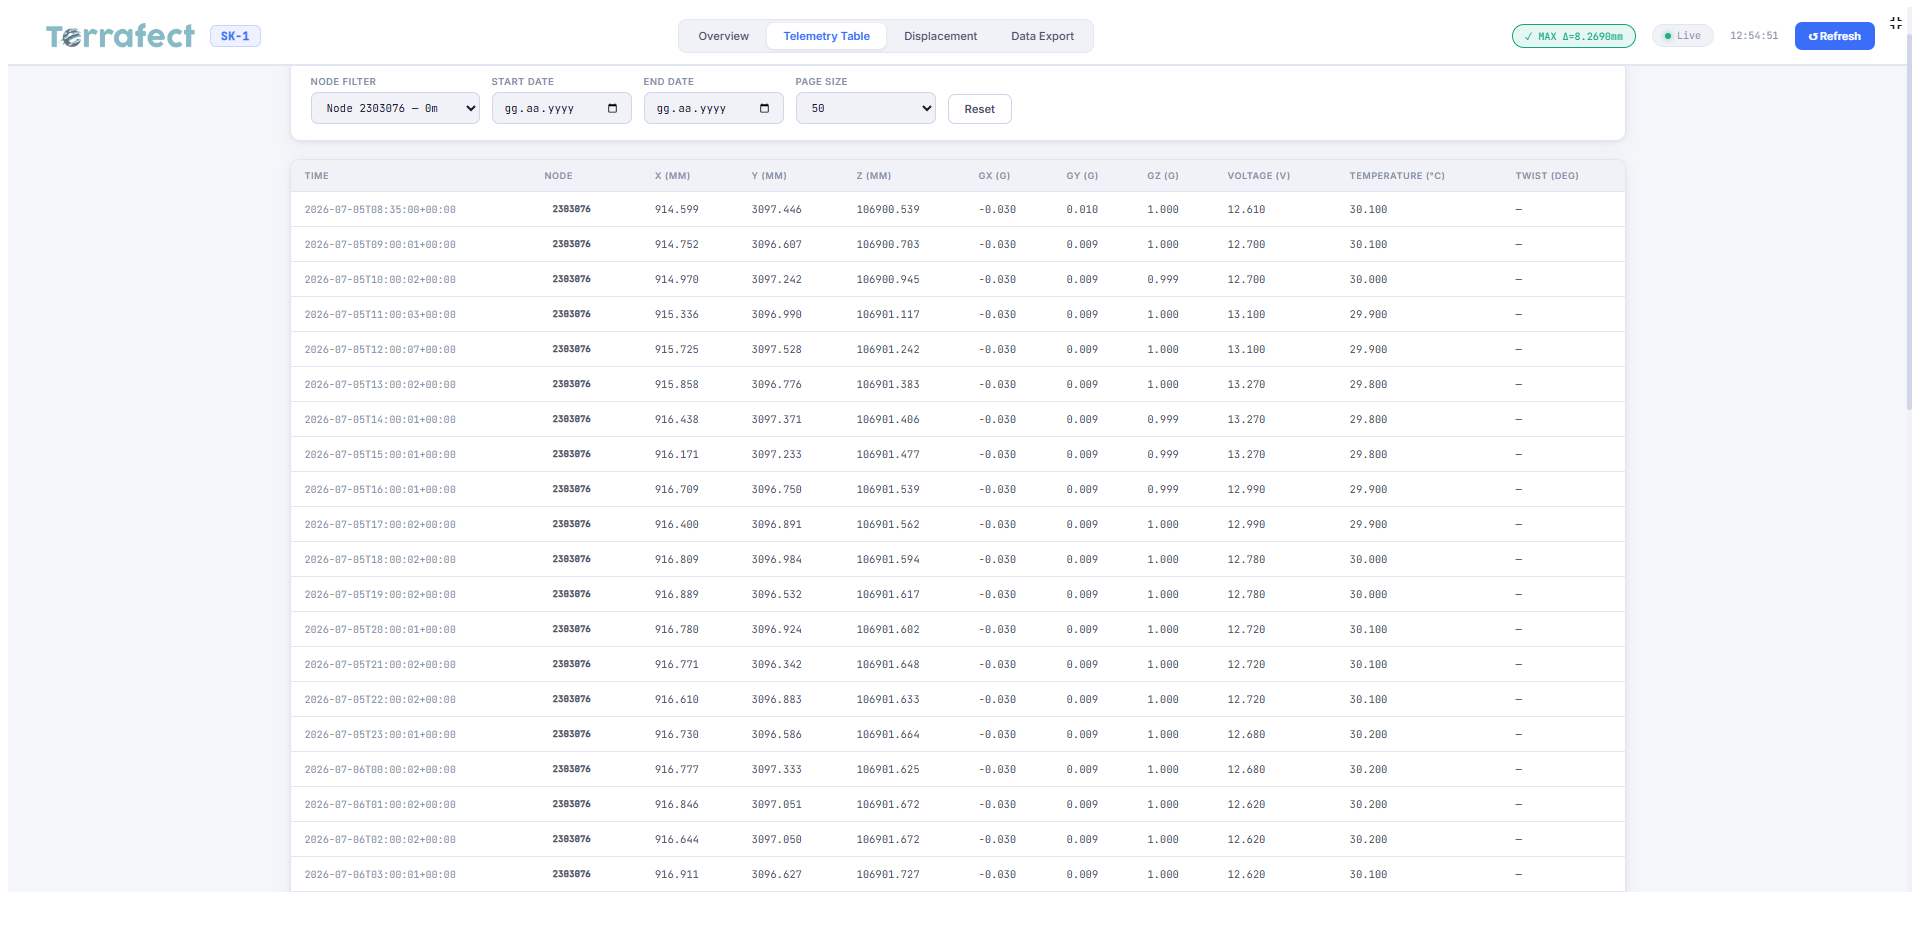
Dashboard view 1 Dashboard view 2 Dashboard view 3 Dashboard view 4 Dashboard view 5 Dashboard view 6 Dashboard view 7 Dashboard view 8 Dashboard view 9

Sensors in the field. Insight on your screen.
Decisions made smarter.

Built on Field Experience.
Designed for Real-World Monitoring.

Multi-Sensor Support

From load cells and strain gauges to in-place inclinometers, time domain reflectometers, crackmeters, survey prisms and piezometers, Terrafect combines data streamed from a complete range of node- and sensor-based monitoring hardware into a single cloud platform, creating value for mining, infrastructure, structural, and environmental applications.

Grounded in Field Experience

Terrafect is built on hands-on field experience in geotechnical and structural monitoring projects, from sensor installation to real-time data interpretation and back calibration of numerical models.

Zero lock-in

Terrafect Cloud is designed to work with multiple sensor types, dataloggers and communication technologies, so your monitoring system stays flexible and scalable.

  • Choose your hardware: integrate sensors and dataloggers from GeoAnts and other manufacturers.
  • Own your data: access and export monitoring data without restrictions.
  • Switch platforms: migrate to Terrafect without losing your historical data.
  • Avoid proprietary dependencies: Terrafect uses open standards and supported communication protocols, and both raw and end-user data stay secure.
Detect Early. Act in Time. Protect Assets.

Stay connected to your site at all times with live dashboards, automated alerts, reports and continuous performance tracking.

Features

Where Real-World Measurements
Meet Digital Intelligence

Terrafect bridges physical assets and their digital twins, bringing sensor measurements to life through real-time visualization and contextual insights. Understand asset behavior, recognize critical changes, and make better-informed decisions.

Inclinometer 1 Inclinometer 2 Inclinometer 3 Inclinometer 4 Inclinometer 5 Inclinometer 6 Inclinometer 7 Inclinometer 8 Inclinometer 9 Inclinometer 10 Inclinometer 11 Inclinometer 12 Inclinometer 13 Inclinometer 14 Inclinometer 15 Inclinometer 16 Inclinometer 17

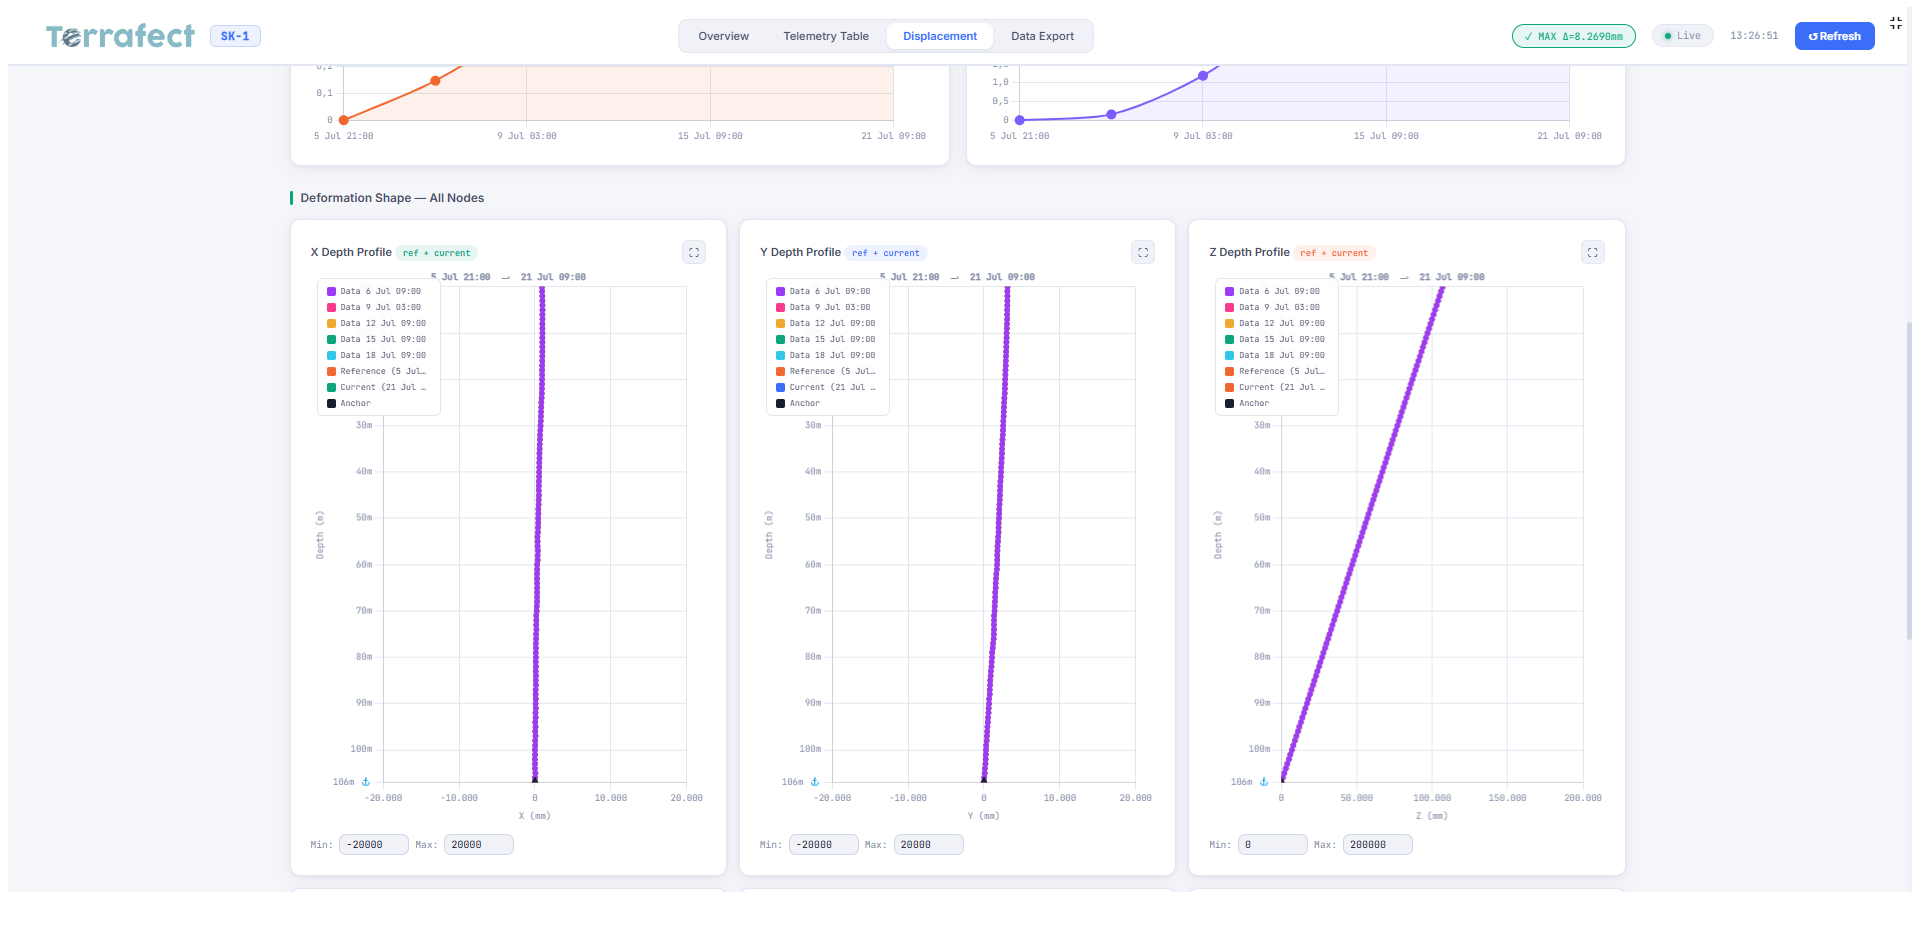
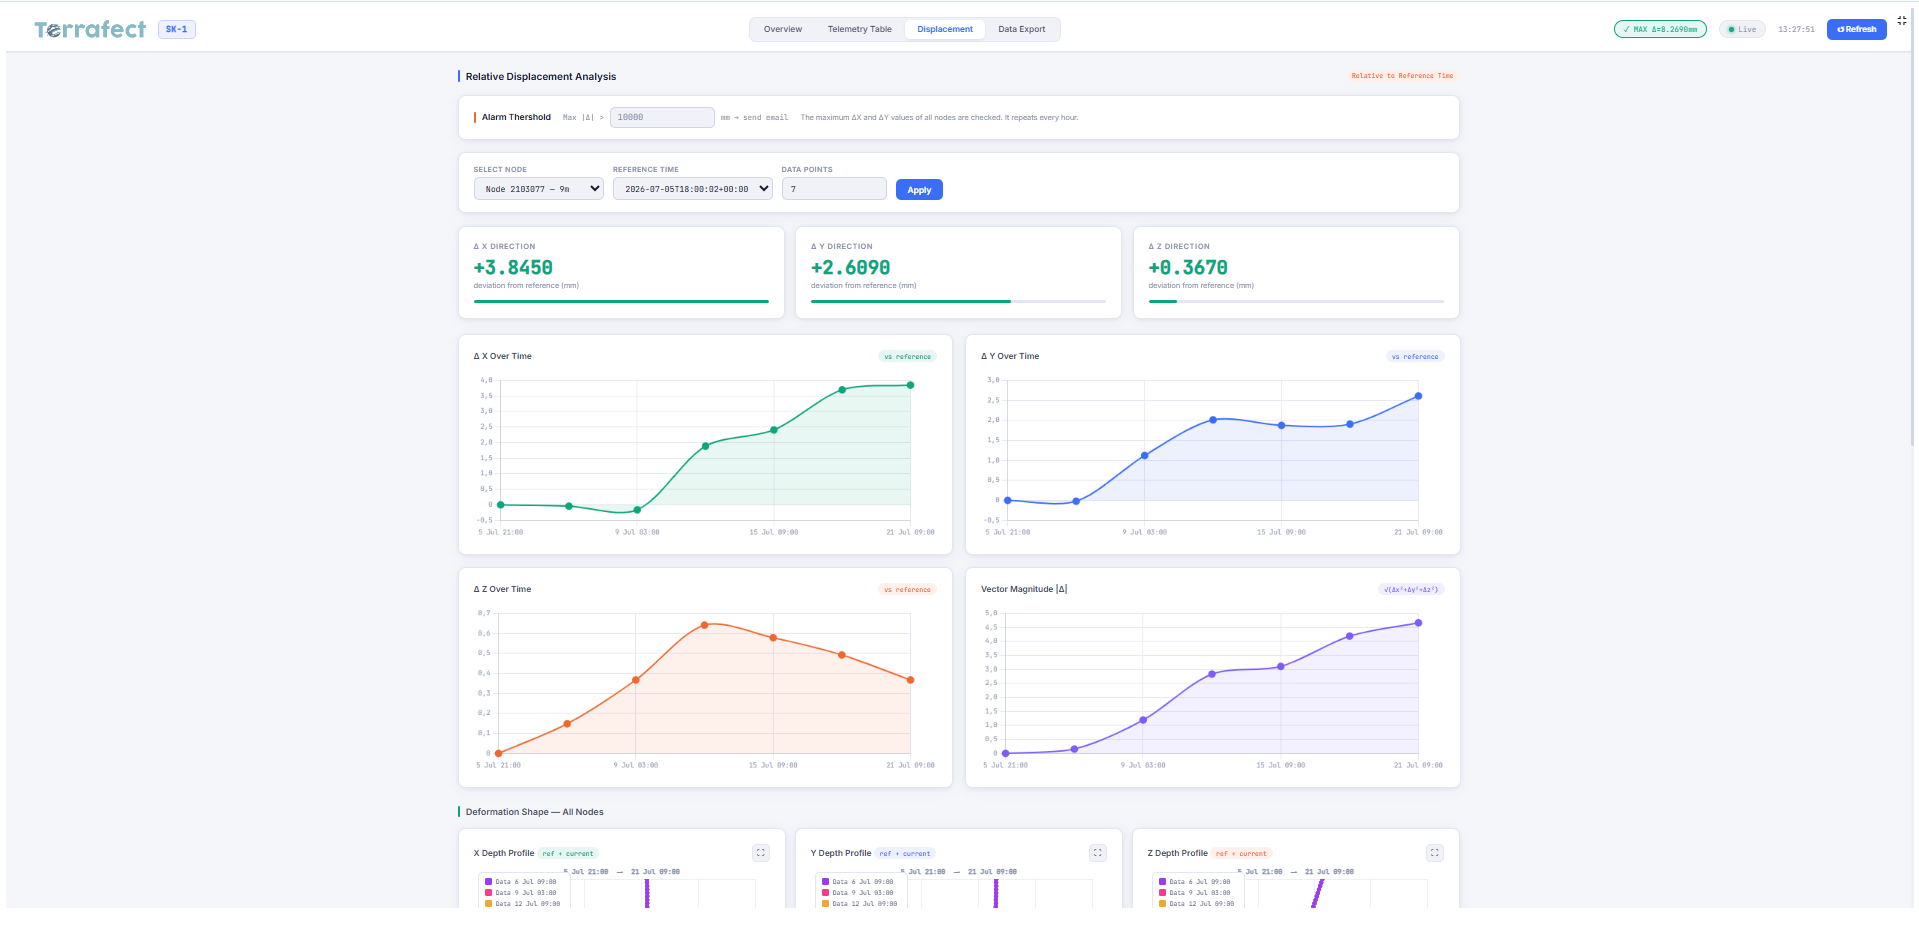
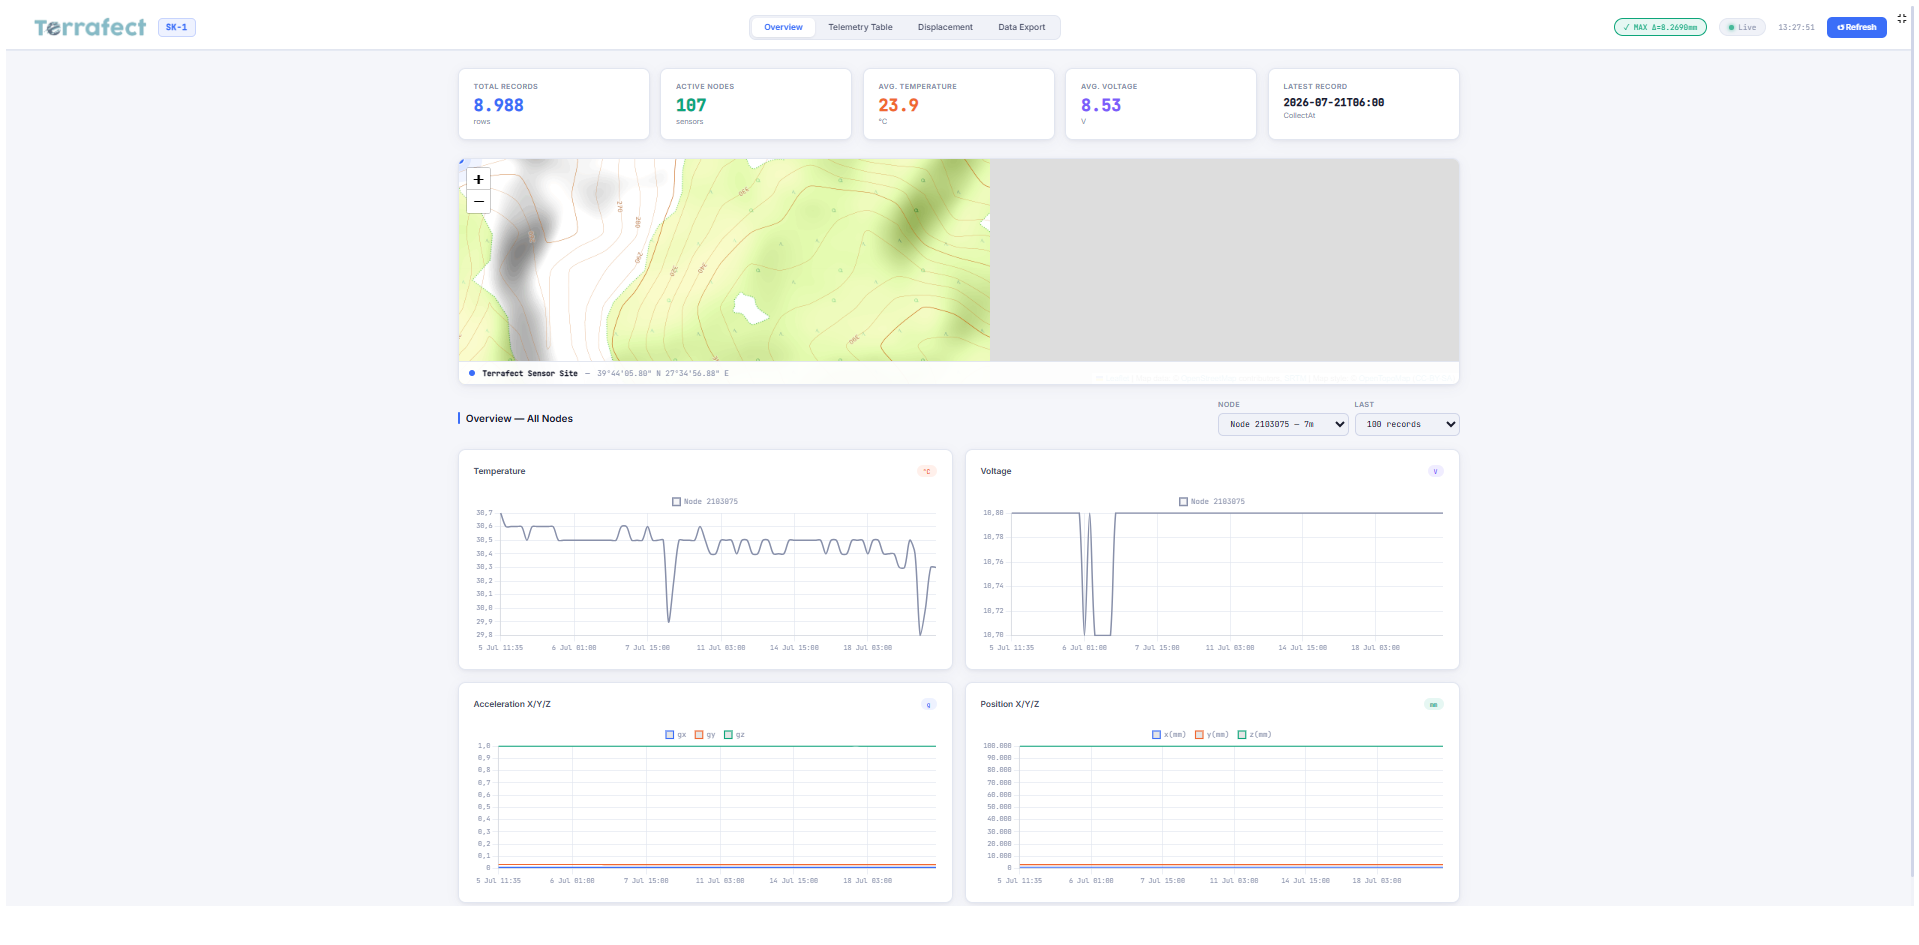
Inclinometer Dashboard

Monitor displacement trends and sensor readings through real-time charts and project-specific dashboards.

Map View 1 Map View 2 Map View 3 Map View 4

Map View

See all monitoring locations on one interactive map with easy access to each sensor and device.

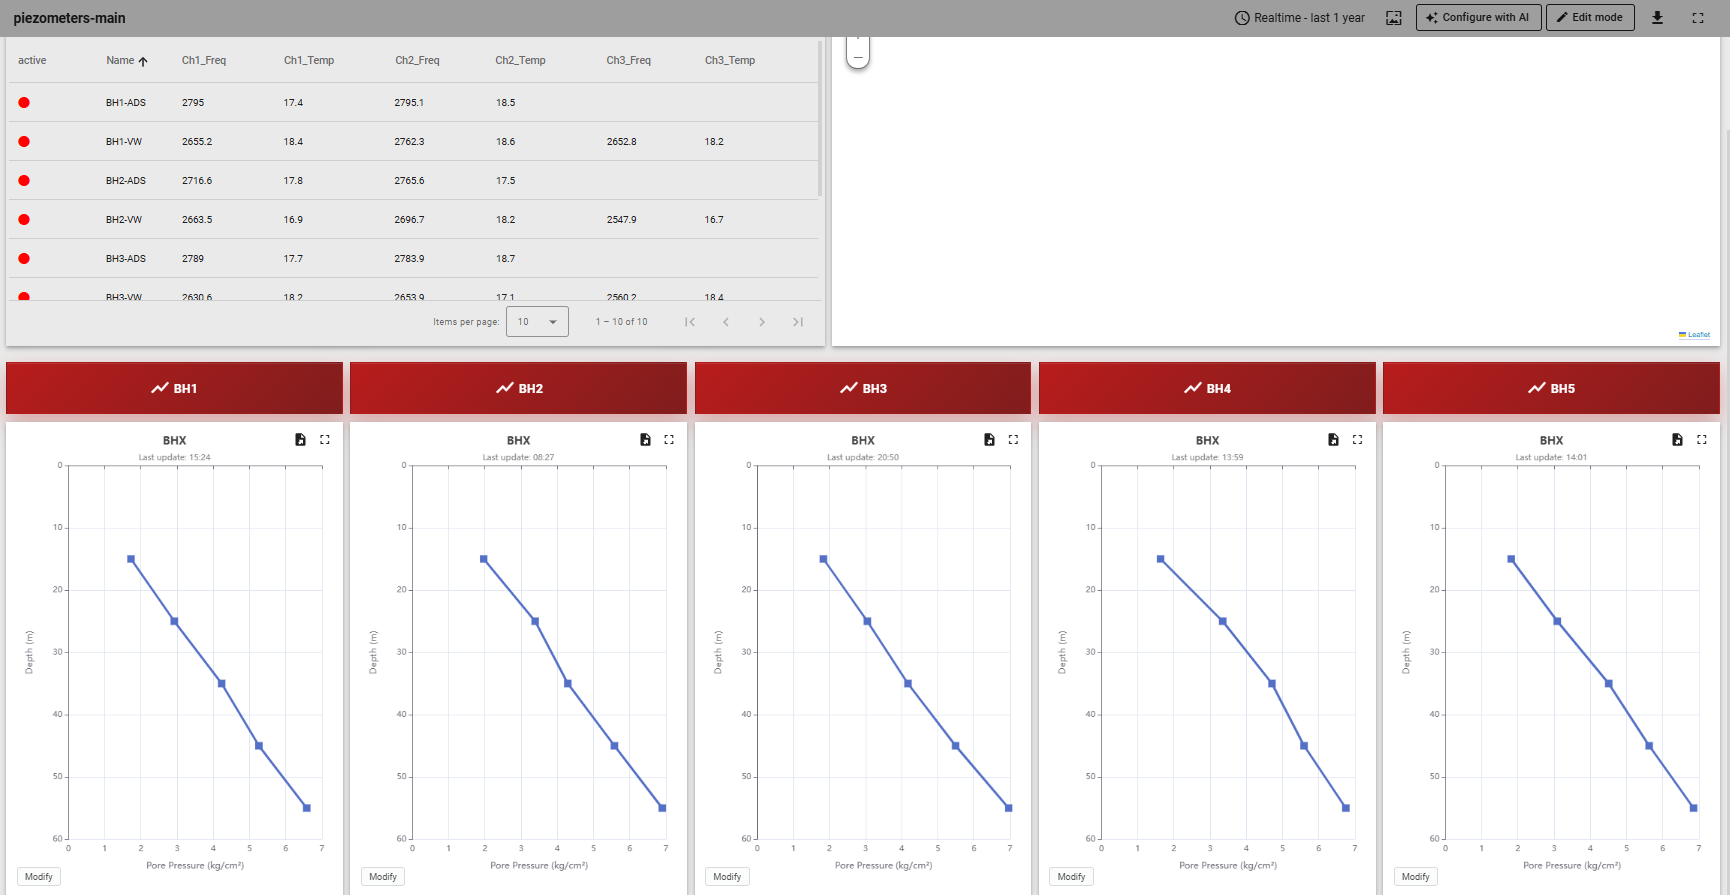
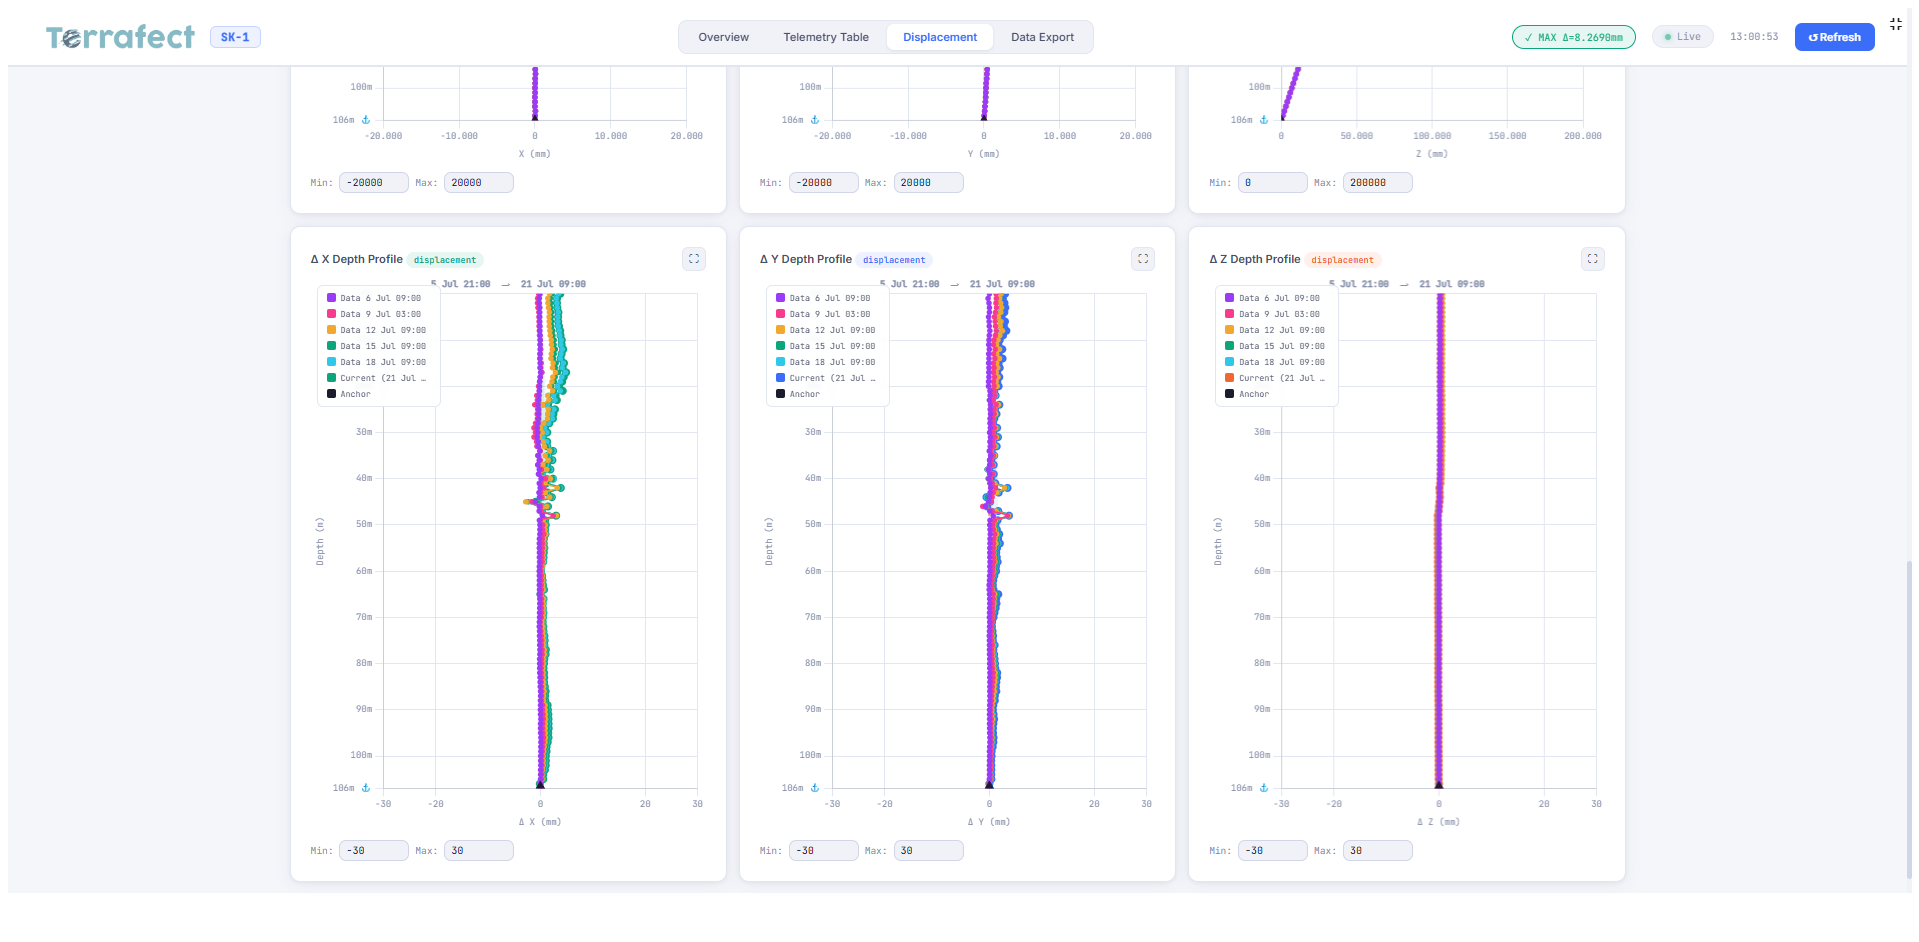
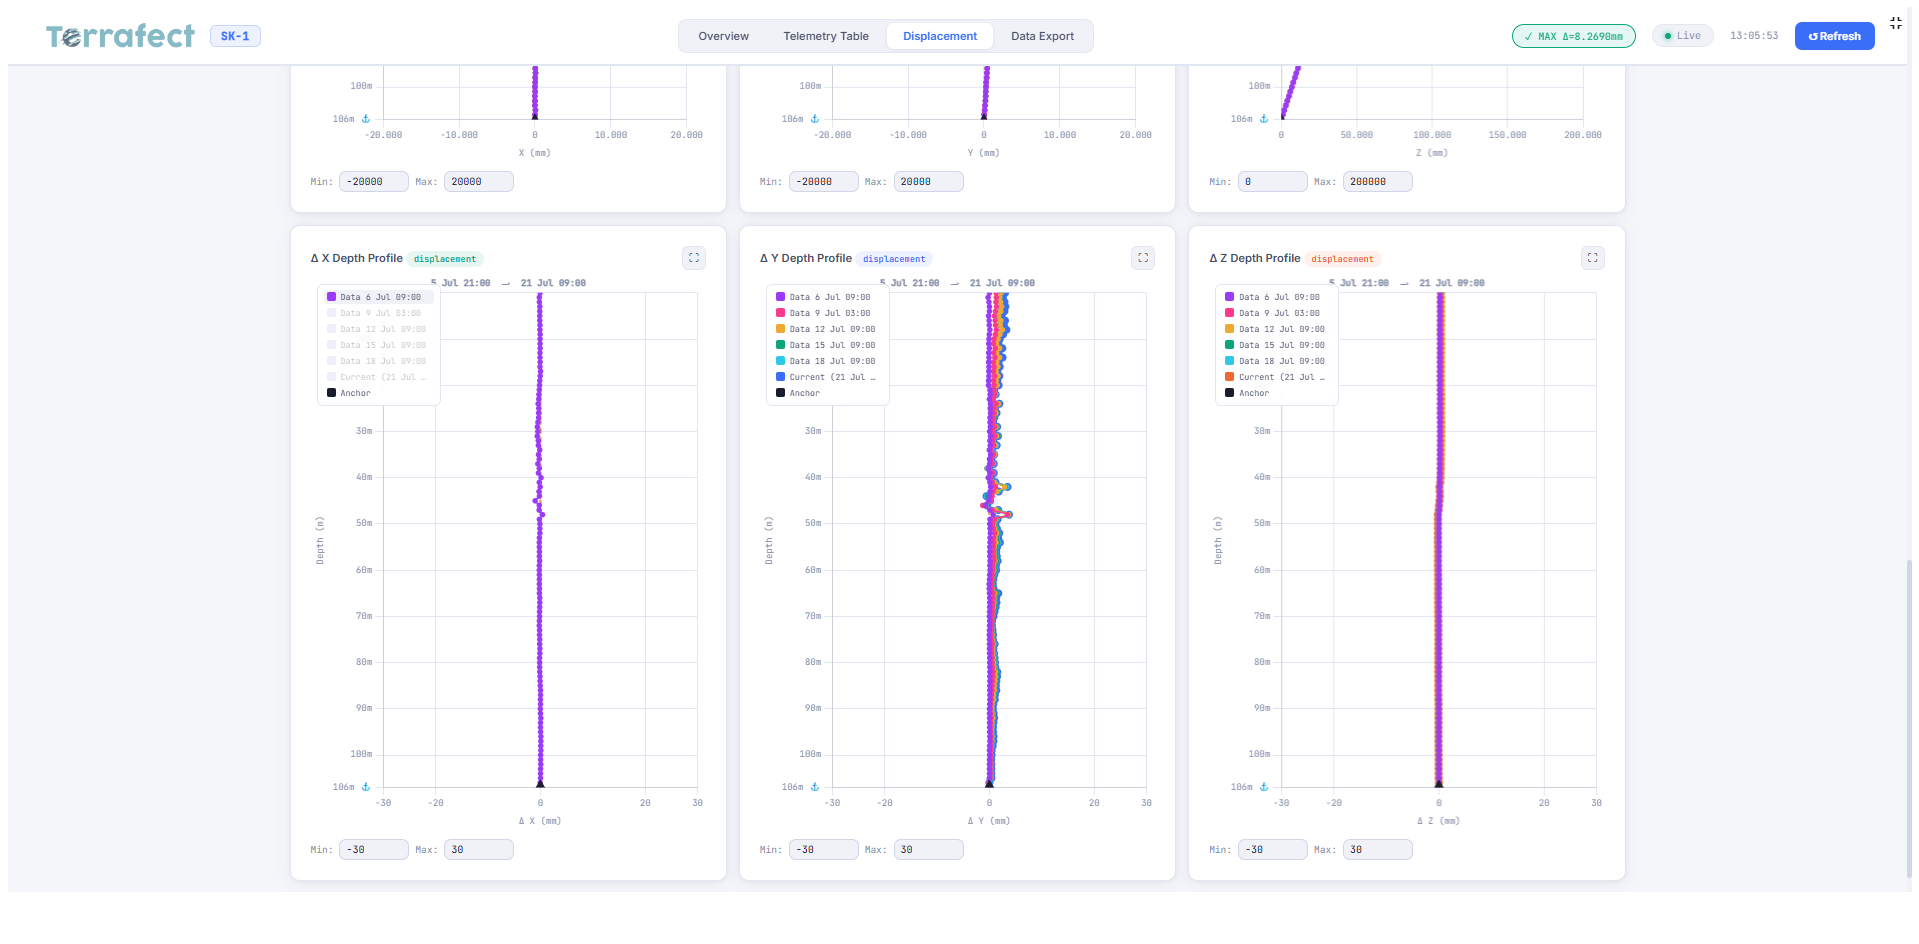
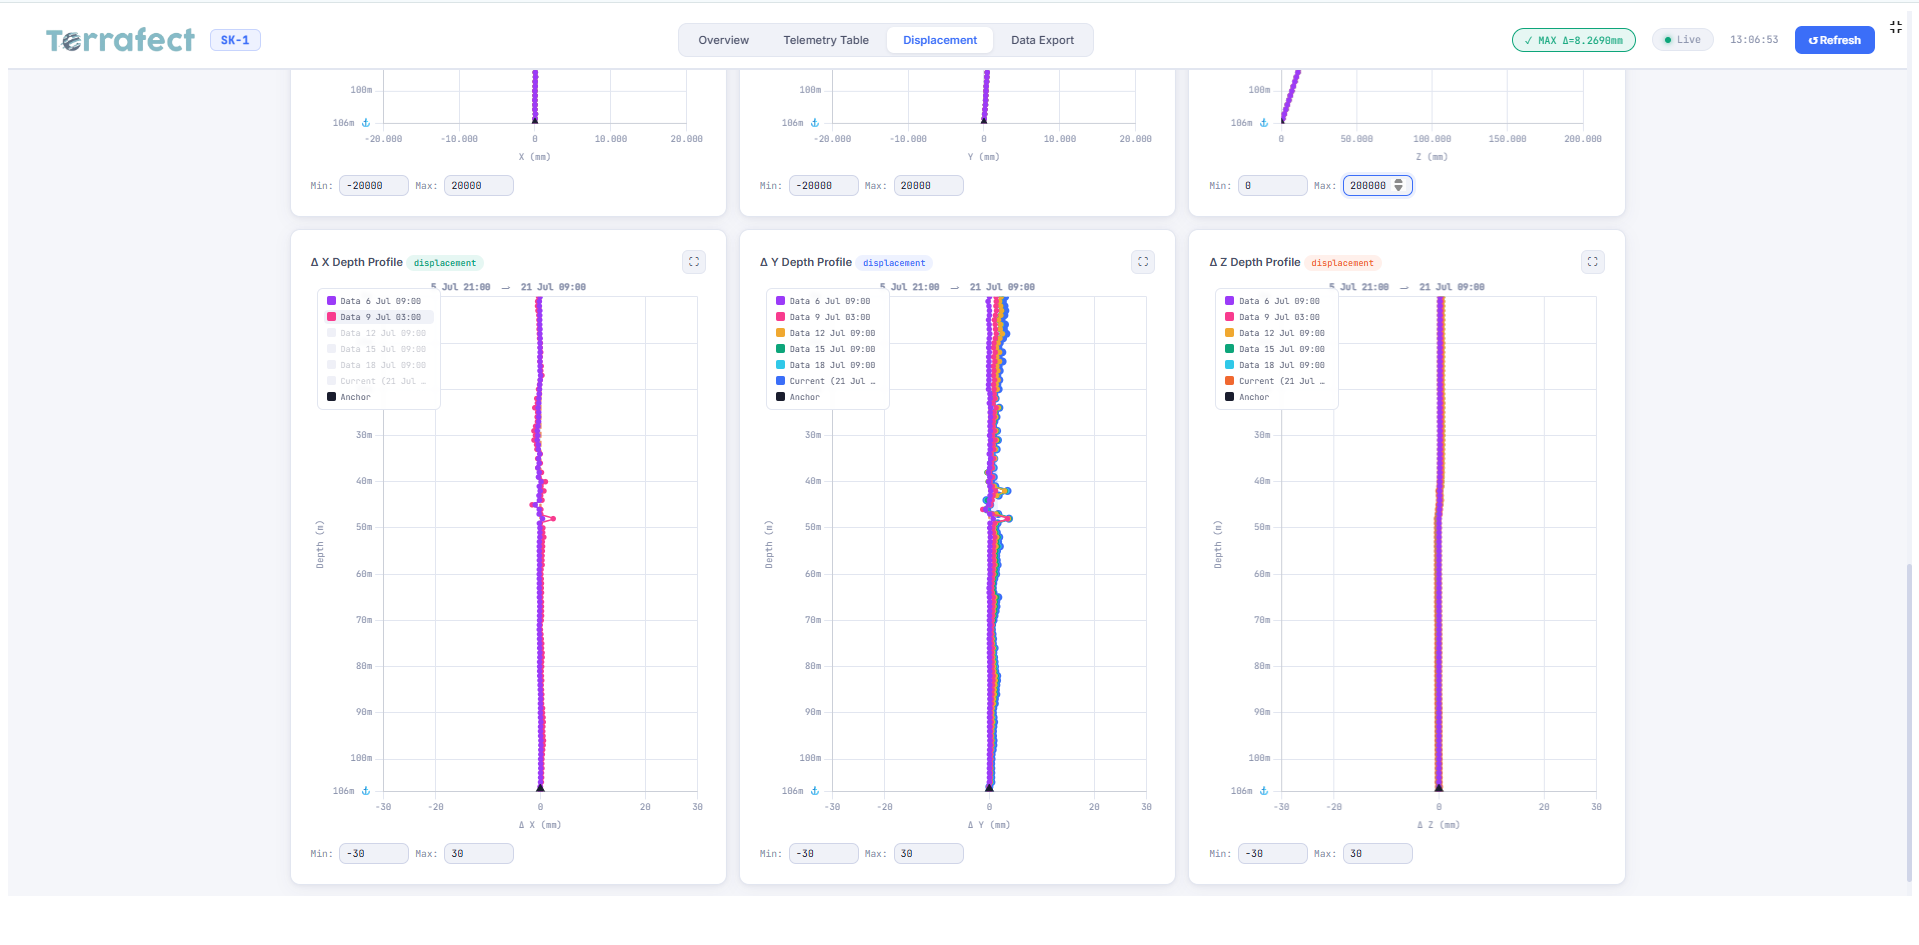
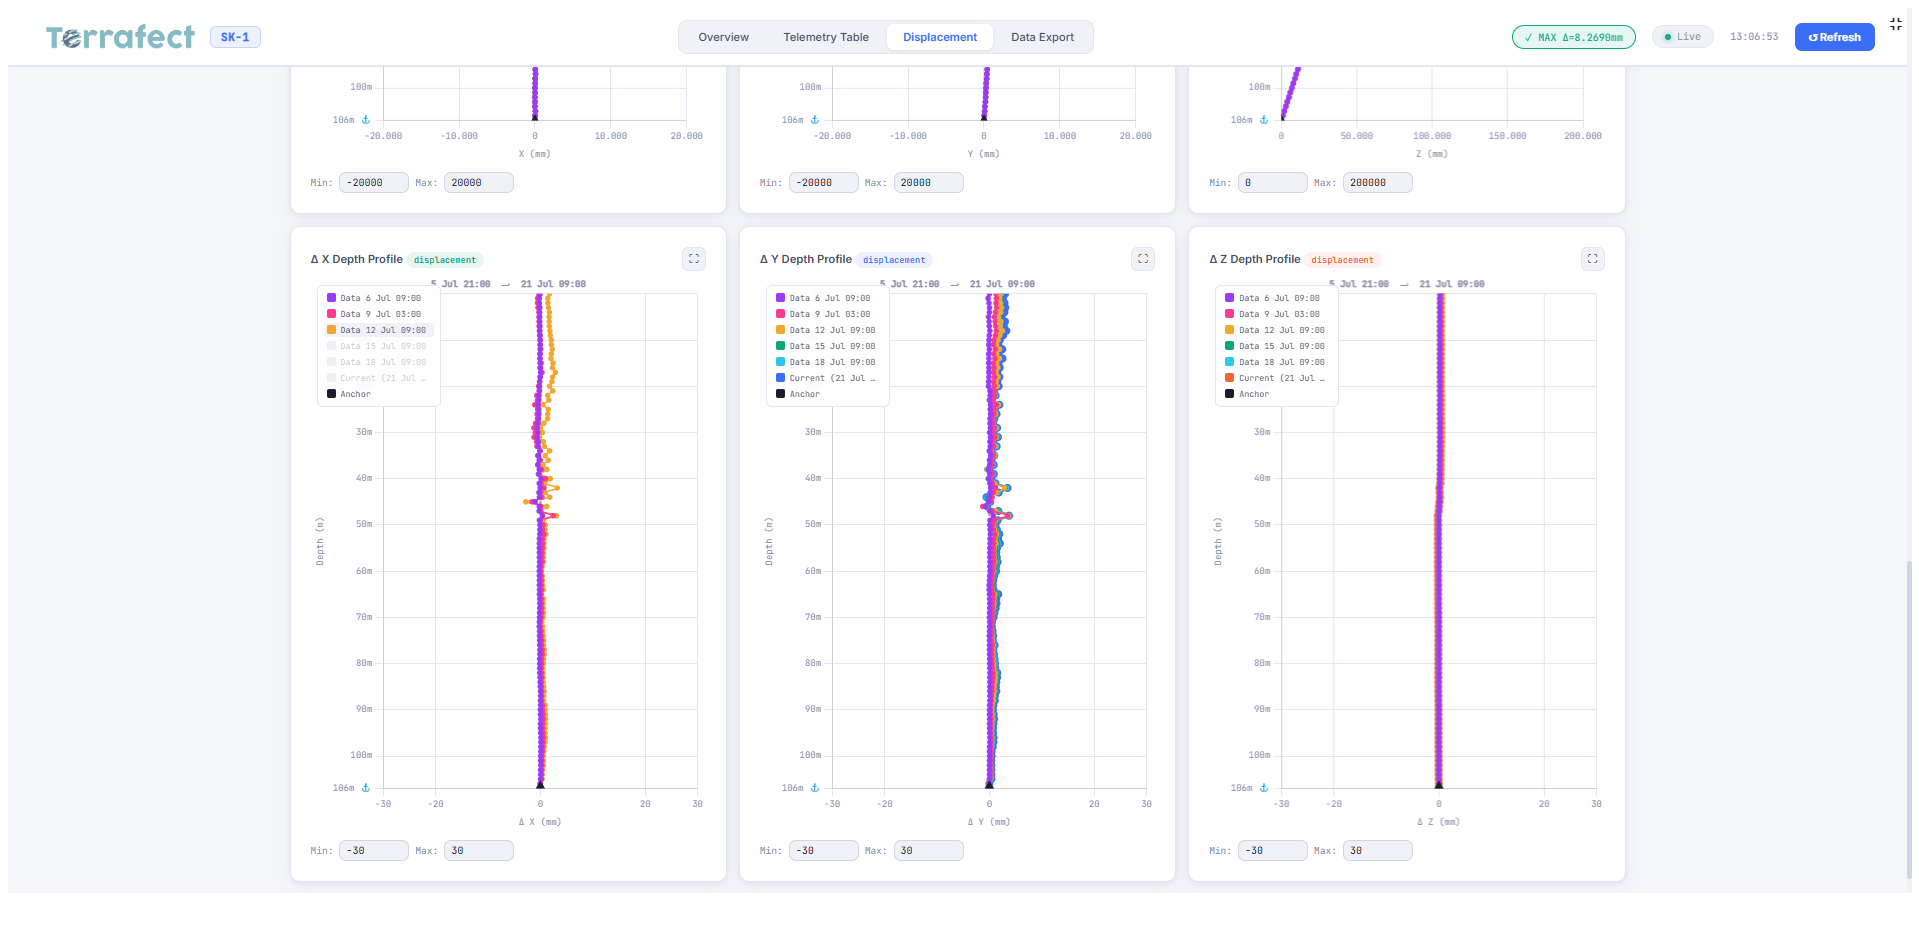
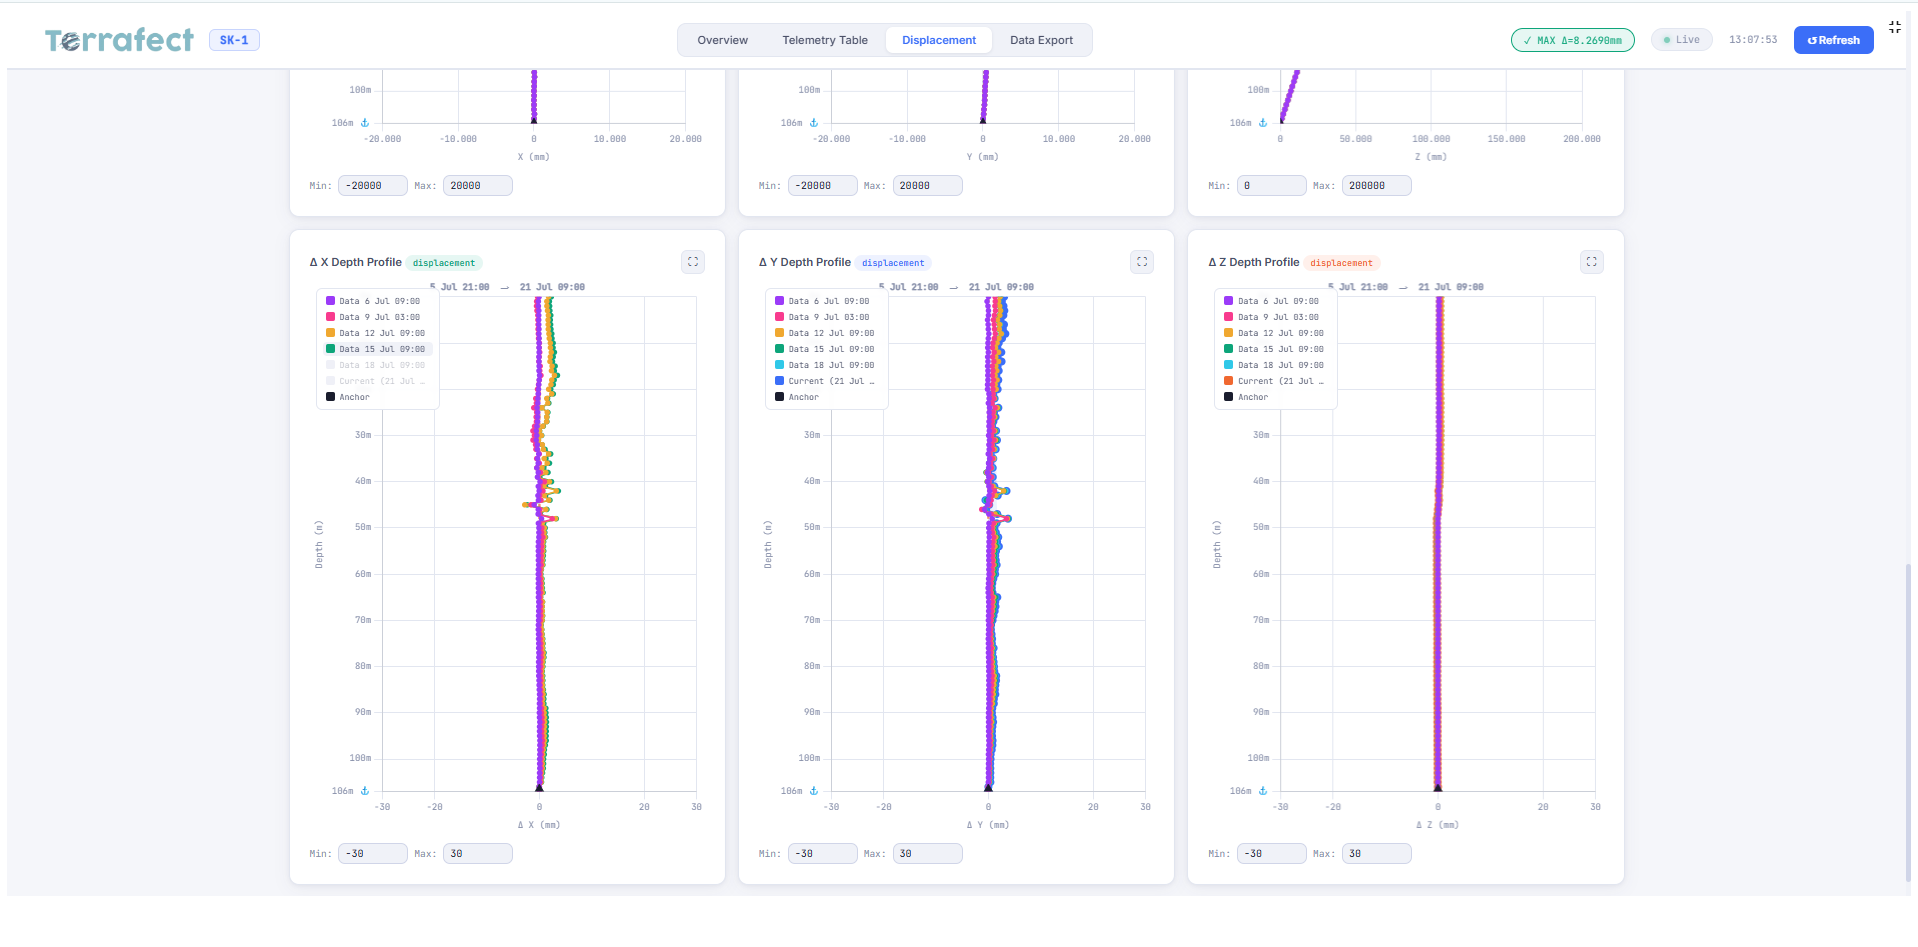
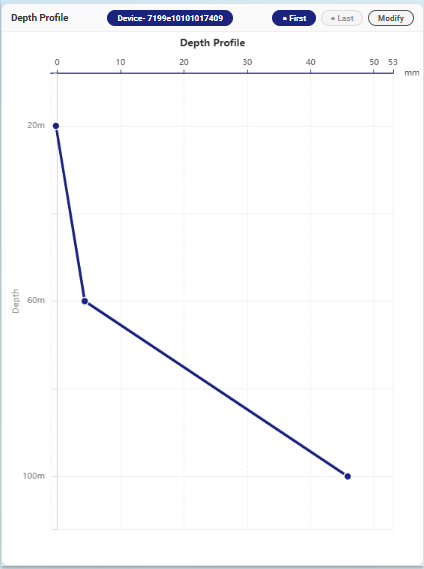
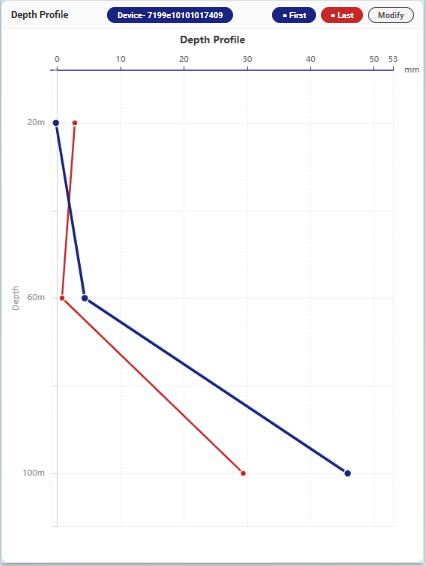
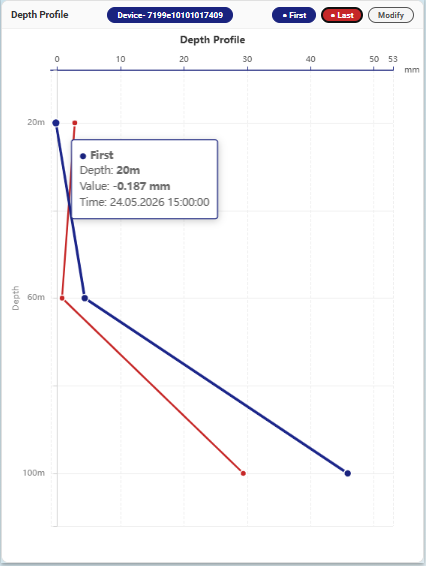
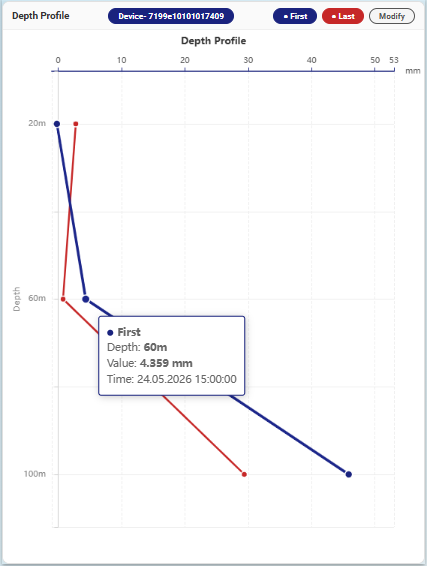
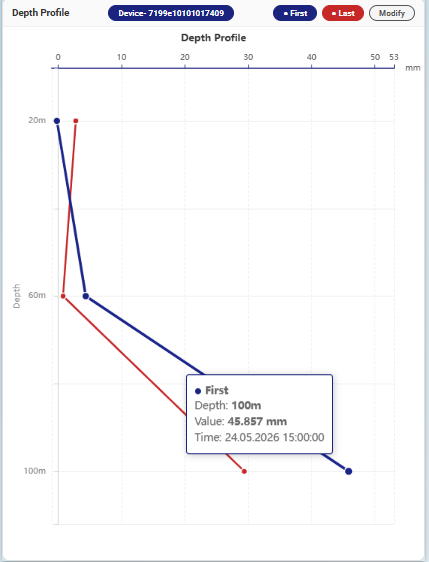
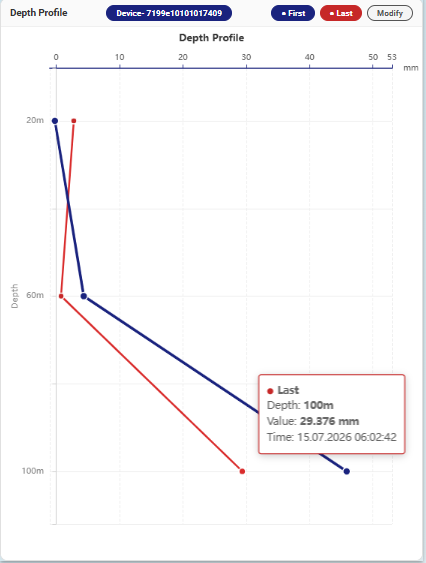
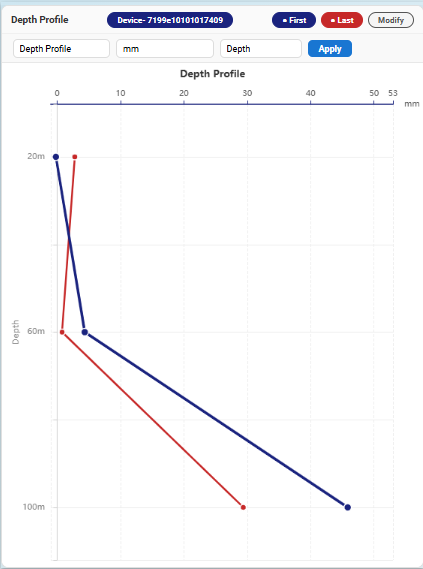
Depth Profile 1 Depth Profile 2 Depth Profile 3 Depth Profile 4 Depth Profile 5 Depth Profile 6 Depth Profile 7 Depth Profile 8

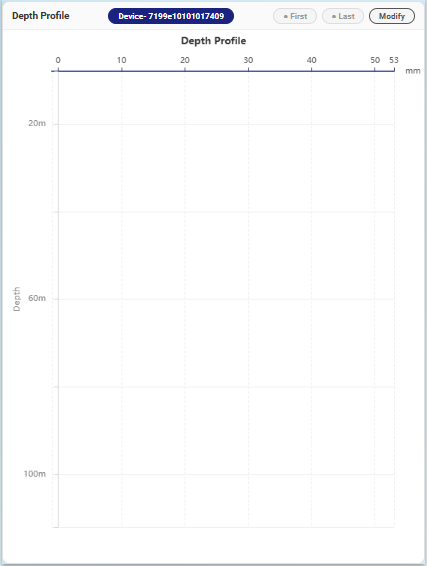
Depth Profile

Analyze how measurements change with depth and detect critical zones in the ground profile.

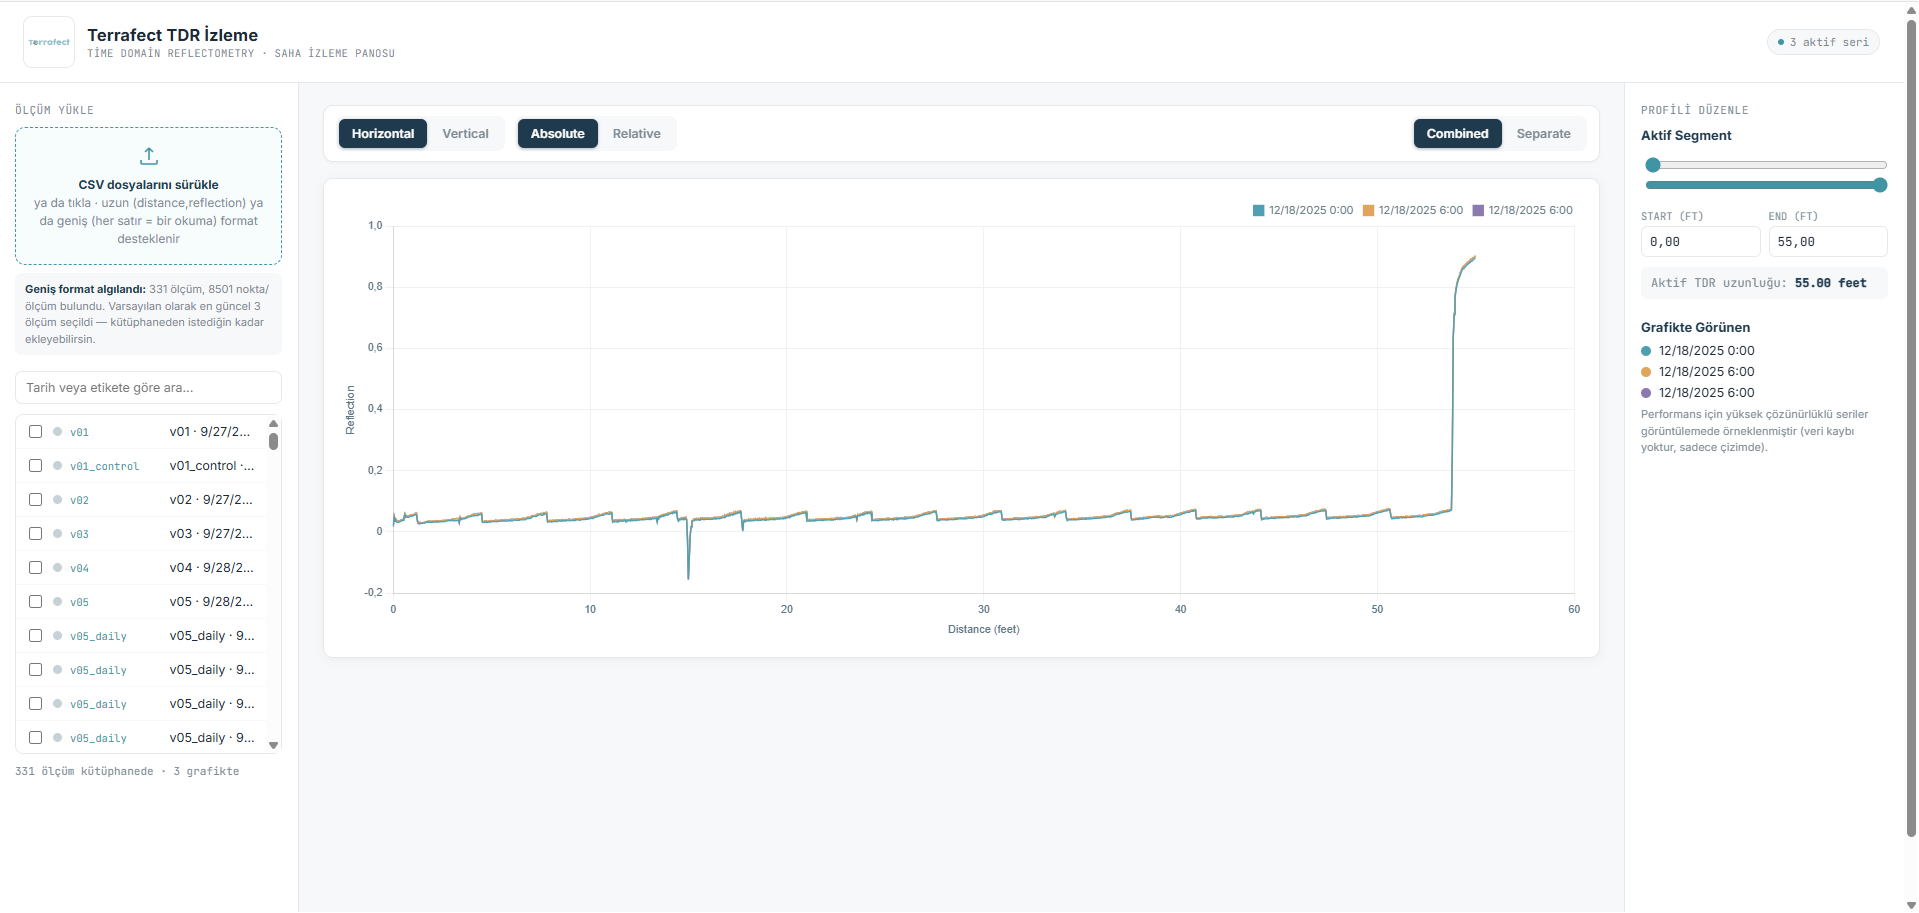
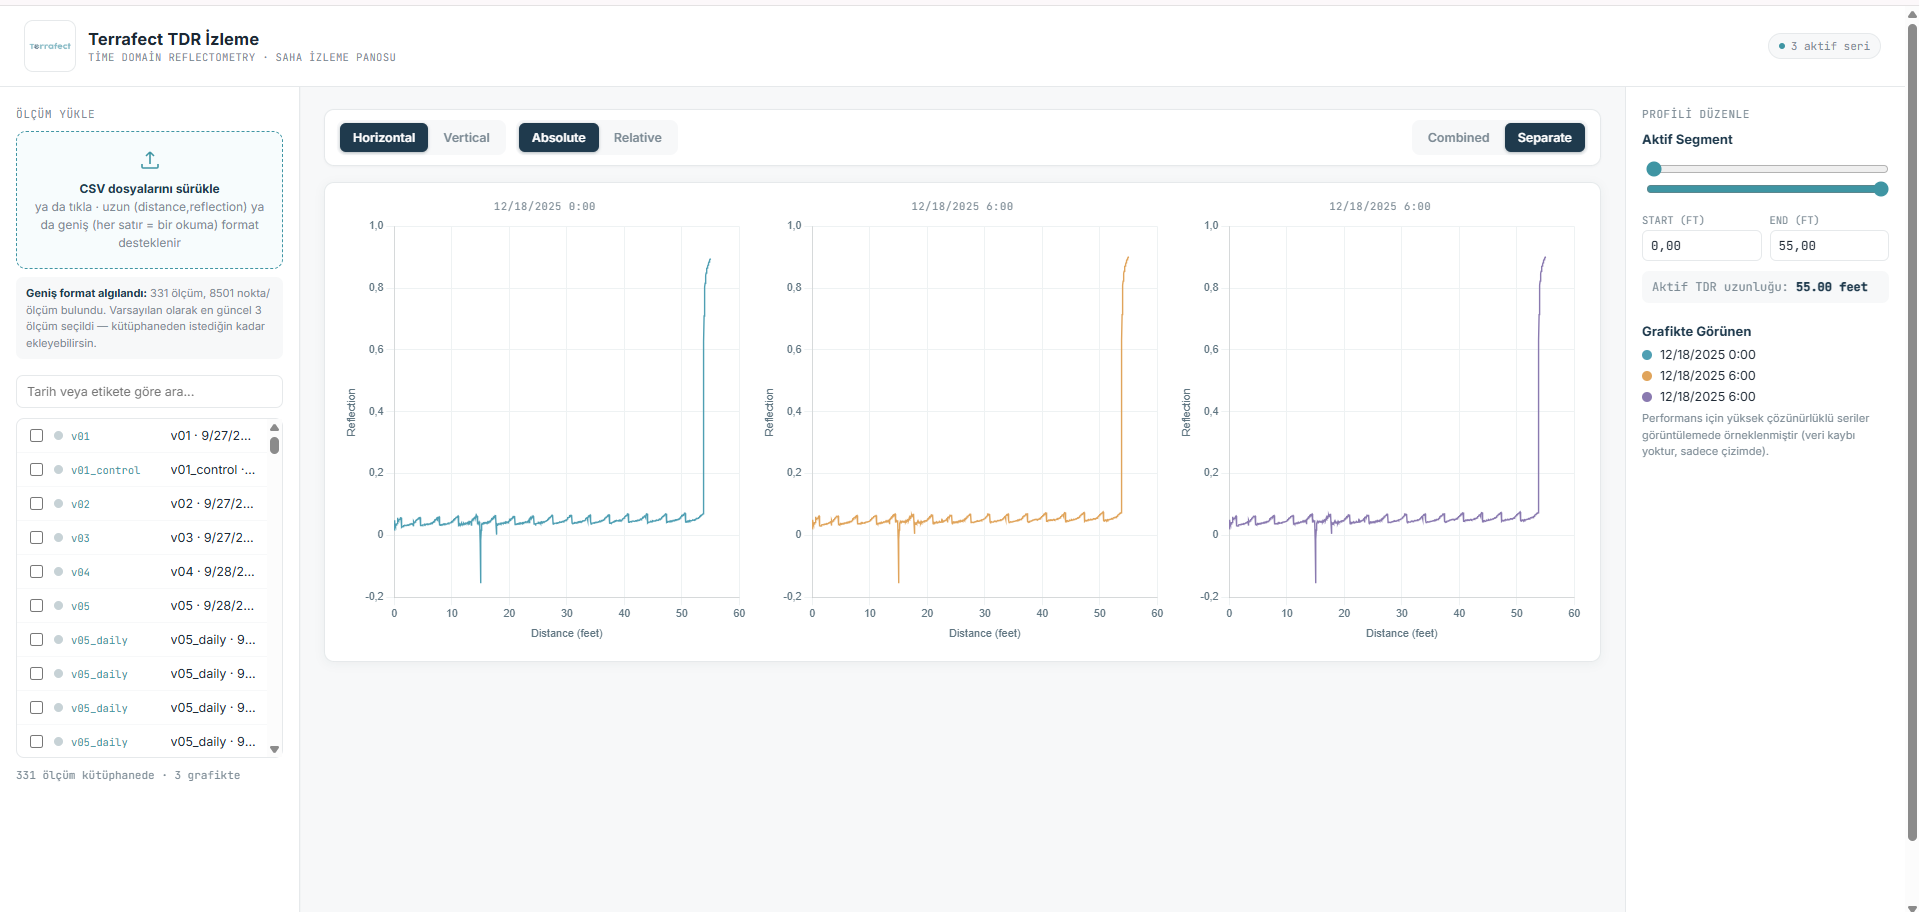
TDR Dashboard 1 TDR Dashboard 2 TDR Dashboard 3 TDR Dashboard 4 TDR Dashboard 5

TDR Dashboard

Track time domain reflectometry readings along each borehole and locate shear zones as they develop.

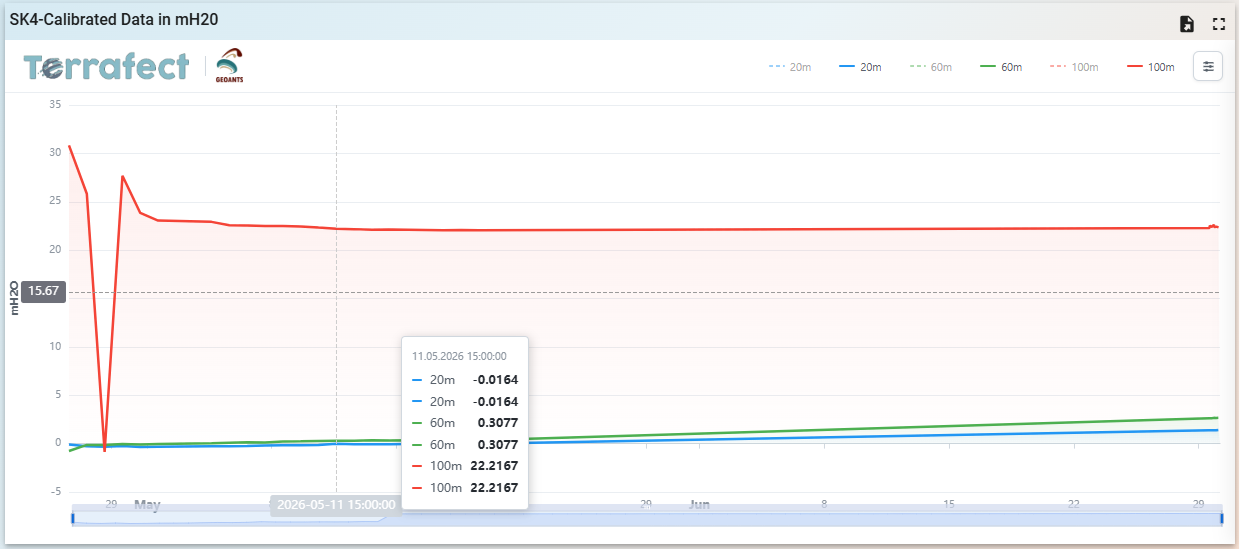
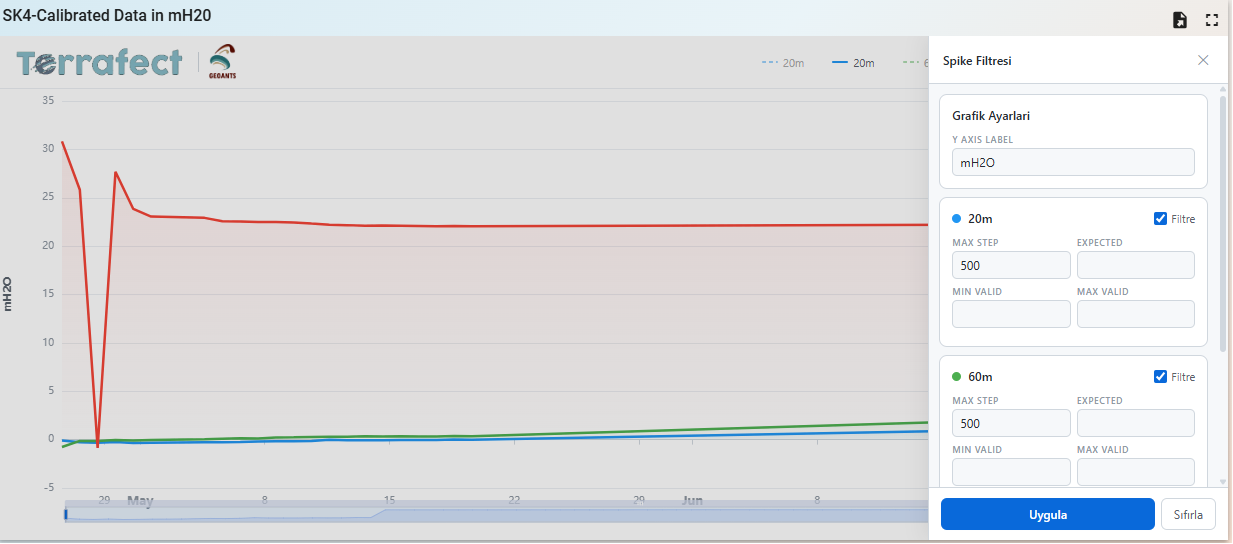
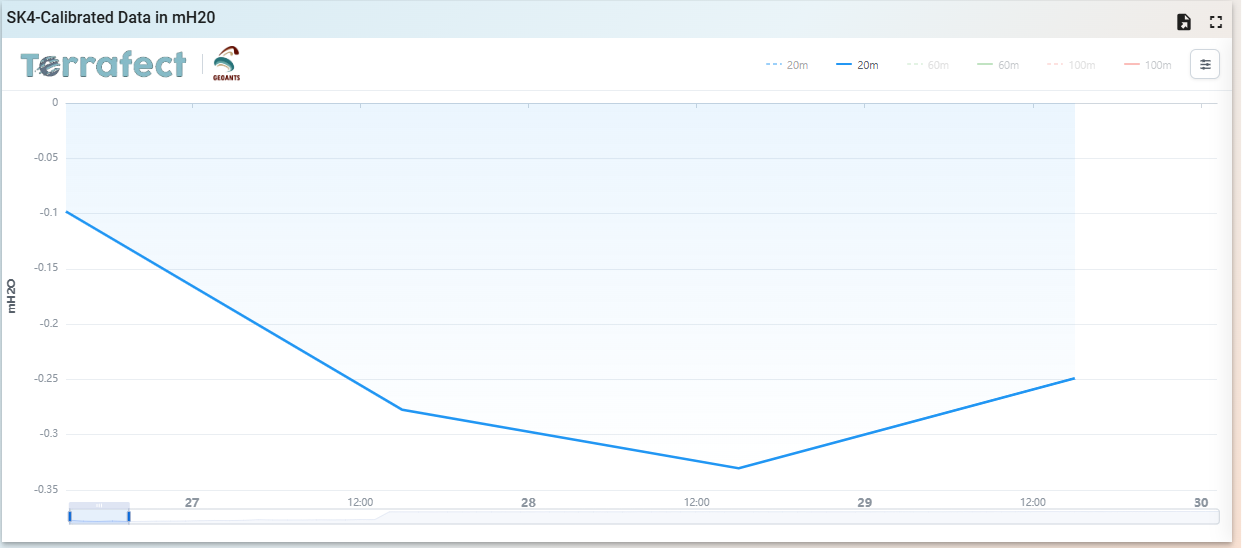
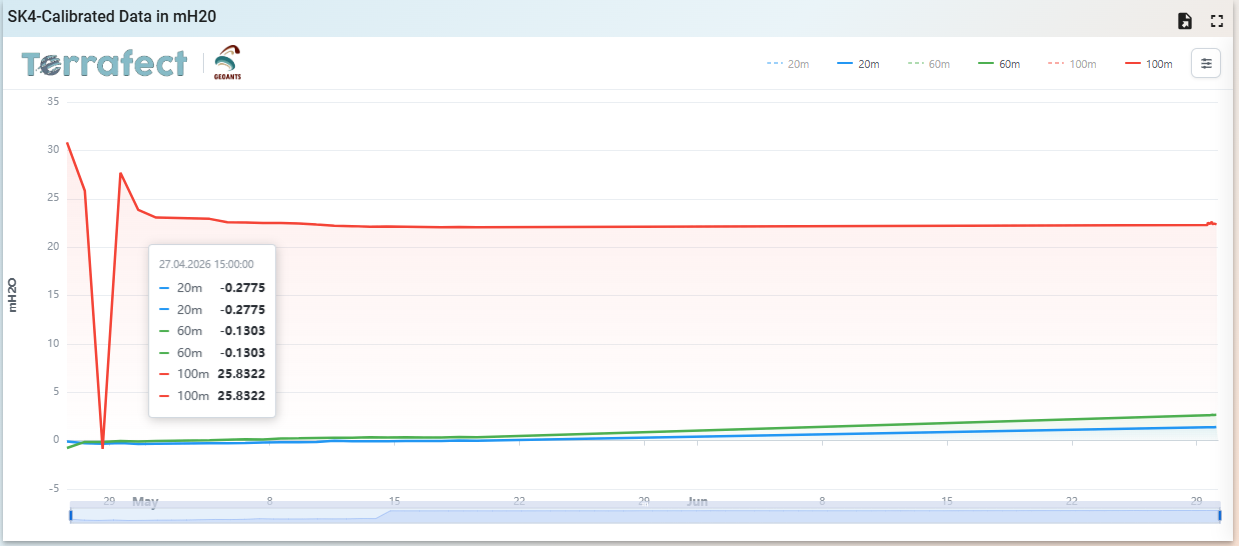
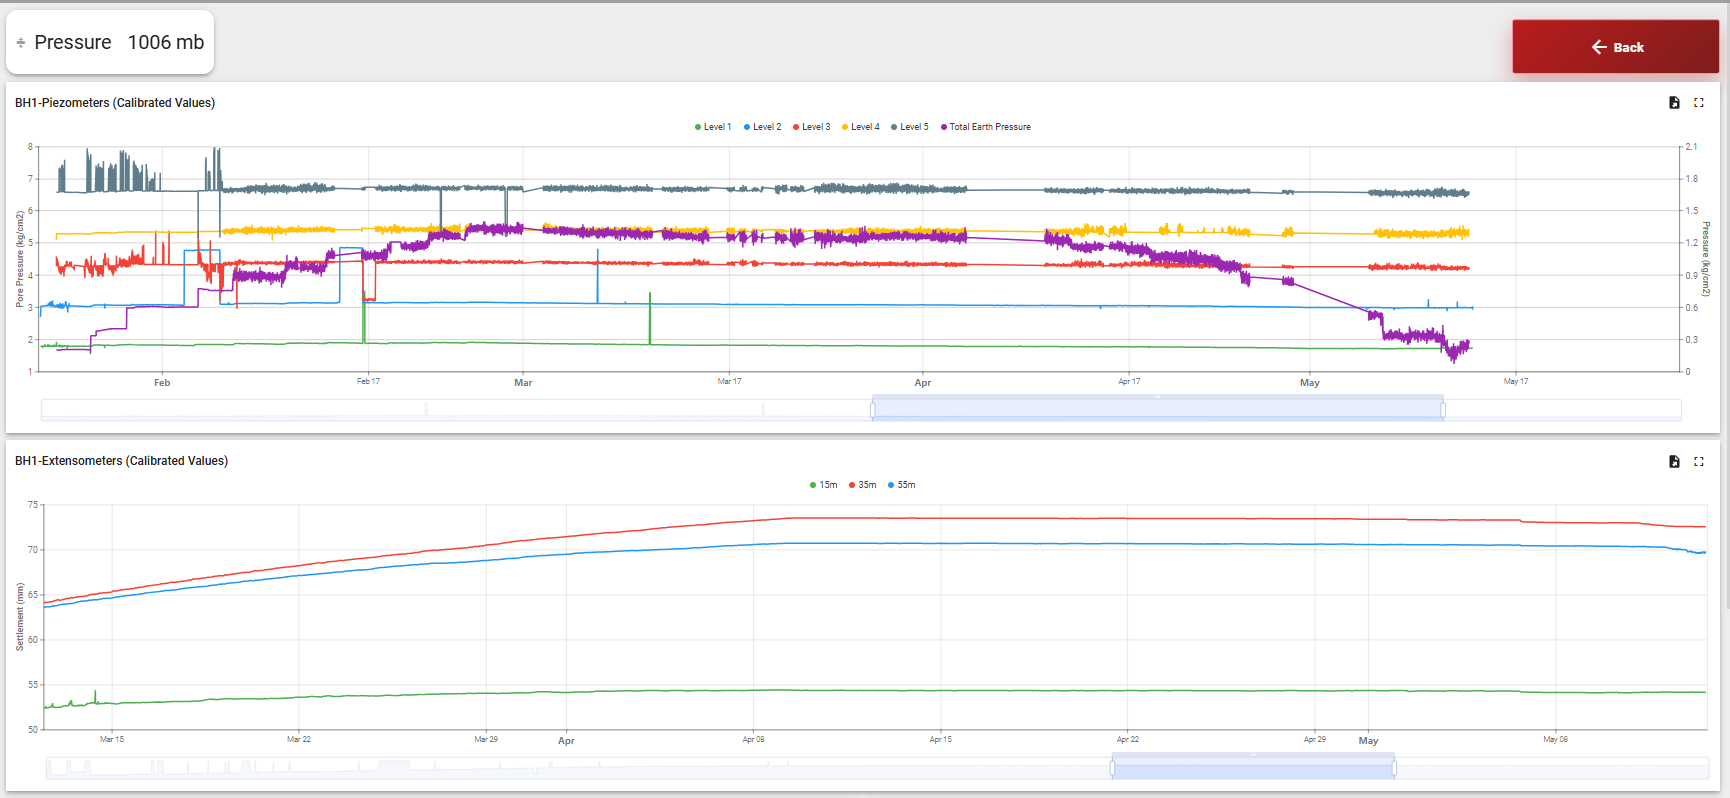
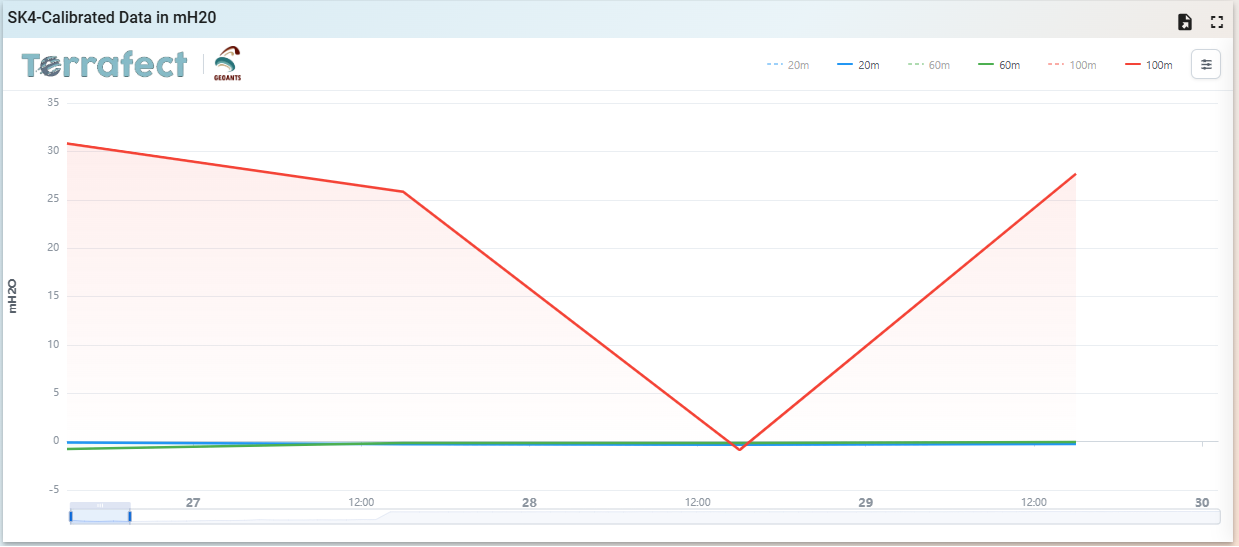
Time Series Dashboard 1 Time Series Dashboard 2 Time Series Dashboard 3 Time Series Dashboard 4 Time Series Dashboard 5

Time Series Dashboard

Follow every sensor channel over time, compare trends side by side and spot changes against alarm levels.

Industries

Built for the Assets That Matter

From buildings and bridges to mines, dams, and critical infrastructure, every asset tells a story through its measurements.

Transportation & Civil Infrastructure Buildings & Urban Development Mining & Tailings Facilities Dams & Water Infrastructure Energy & Industrial Facilities Slopes & Geohazard Monitoring Heritage & Sensitive Structures Construction & Temporary Works
Explore all industries →

Explore Terrafect

Every monitoring project is different. Let’s discuss your needs and find the right solution, with flexible plans and transparent terms.